objective Ques (356 results)
71)Study the given bar graph and answer the question that follows.
The given bar graph represents the Sales Turnover (in Rs. crore) of five automobile companies A, B. C, D and E during 2014-2015 and 2015-2016. The X-axis represents the Companies, and the Y-axis shows the Sales Turnover (in Rs. crore).
(The data shown here is only for mathematical exercise. They do not represent the actual figures of the company.)
What should have been the sales turn over (in Rs. crore) of Company C in 2015-2016 to have shown the same increase in its sales over 2014-2015 as shown by the sales turnover of Company E?SSC CHSL 2021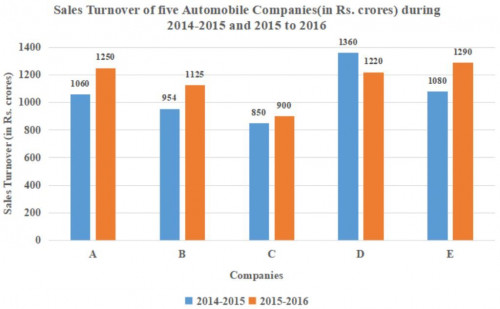
1060
72)Study the given bar graph which shows the life time (in hours) of neon lamps and the number of neon lamps and answer the question that follows.
The number of neon lamps having life 800 hours or more but less than 1000 hours is what percent (correct to nearest integer) of the total number of neon lamps having life 700 hours or less?SSC CHSL 2021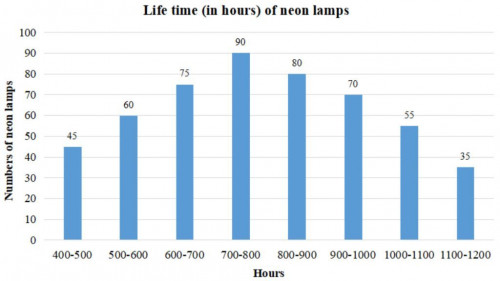
83%
73)Some persons went on an outstation tour. The histogram shows their ages.
If the children of age less than 15 years got concession, then how many persons got the concession?SSC CHSL 2021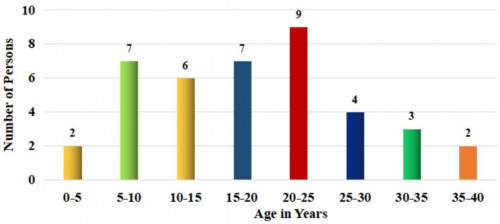
15
74)Study the given graph and answer the question that follows.
What percentage of the imports in 2018 is the average exports in 2013, 2015 and 2017? (correct to one decimal place)SSC CHSL 2021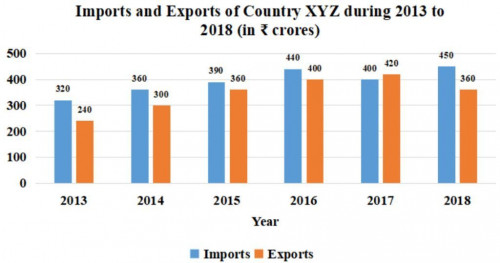
75.6
75)Study the pie chart that shows the quantity wise sales distribution of five products (A, B, C, D and E) of a company in 2019 and answer the question that follows.
Quantity wise sales distribution of five products (A, B, C, D and E)
If 2100 units of product C were sold in 2019 and the total number of units sold by the company in 2020 was 28% more than that in 2019, then how many units were sold by the company in 2020?SSC CHSL 2021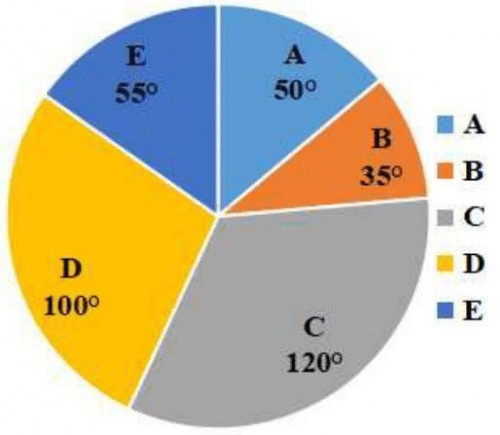
8064
76)The given bar-graph shows the number of boys and girls in classes A, B, C and D in a school, and the number of teachers allotted to each class.
Which class has the least percentage of girls?SSC CHSL 2021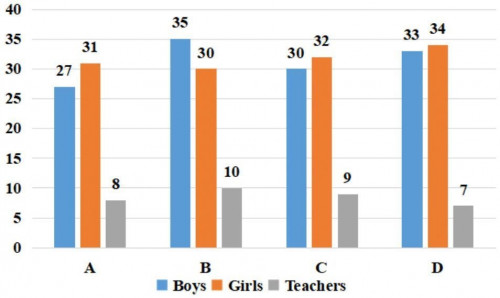
B
77)Study the given graph and answer the question that follows.
The total number of computers of type A sold in January and May is what percentage less than the total number of computers of type B sold from March to May? (correct to one decimal place)SSC CHSL 2021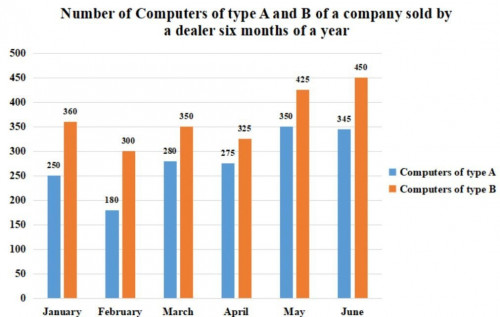
45.5
78)Study the given graph and answer the question that follows.
What is the ratio of the total revenue of the company in 2015 and 2018 to the total expenditure in 2017 and 2018?SSC CHSL 2021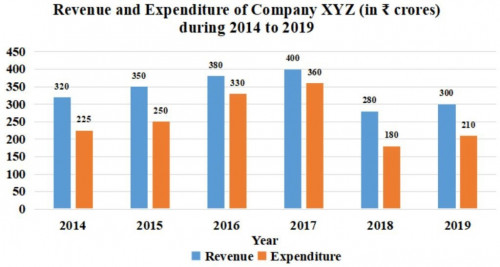
7 ∶ 6
79)Study the following bar graph and answer the question that follows.
The average export of diamonds for the given period (in Rs.crores) was:SSC CHSL 2021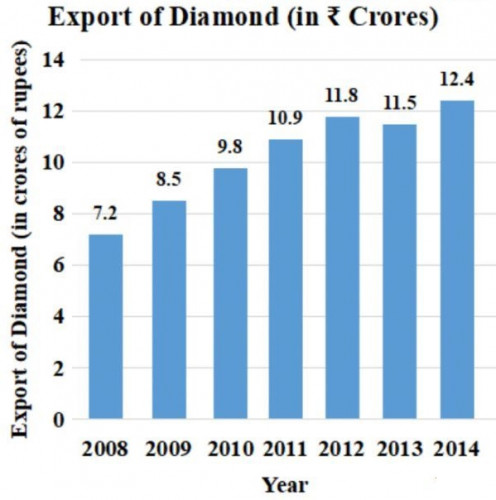
10.3
80)Study the given graph and answer the question the follows.
In 2019, if the production of vehicle of type A increased by the same percentage as that in 2018, over its previous year, then what was the number (in thousands) of vehicle of type A produced in 2019?SSC CHSL 2021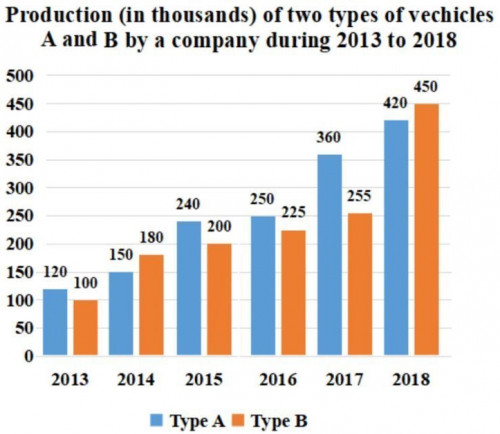
490