objective Ques (356 results)
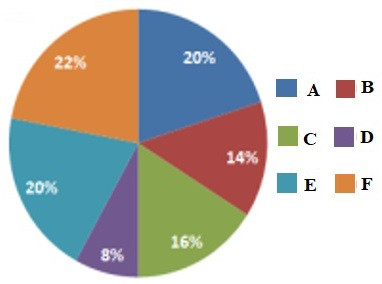
SSC CPO 2020191)The given pie chart shows the percentage distribution of 450 employees in an organization. Read the pie chart and answer the question that follows.
If 75% of the employees in department D are males, how many female employees are there in that department?
9
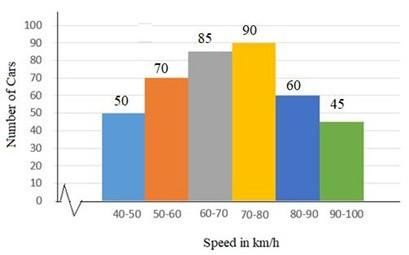
SSC CPO 2020192)The given histogram shows the frequency distribution of the speed of cars passing through a particular spot on a highway. Read the graph and answer the following questions.
The number of cars with speed (km/h) in the interval (60 - 70) km/h is what percentage less than the number of cars with speed (km/h) in the interval (70 - 80) km/h? (correct to one decimal place)
5.6%
SSC CPO 2020193)The given pie chart shows the percentage distribution of 450 employees in an organisation. Read the pie chart and answer the question that follows.
What is the number of employees working in department F?
99
SSC CPO 2020194)The given pie chart shows the percentage distribution of 450 employees in an organisation. Read the pie chart and answer the question that follows.
What is the central angle of the sector representing the number of employees in department E?
72°
SSC CPO 2020195)The given histogram shows the frequency distribution of the speed of cars passing through a particular spot on a highway. Read the graph and answer the following question.
What is the ratio of the number of cars with speed less than 60 km/h to the number of cars with speed more than 70 km/h?
8 : 13
SSC CPO 2020196)The given histogram shows the frequency distribution of the speed of cars passing through a particular spot on a highway. Read the graph and answer the following question.
What percentage of cars were running with the speed of 90 km/hr and above?
11.25%
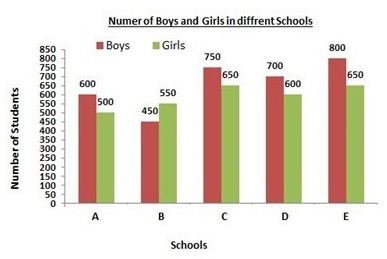
SSC CPO 2020197)The given bar graph represents the number of boys and girls in five different schools. Read the graph and answer the question that follows.
In which school is the percentage of boys more than 55%?
E
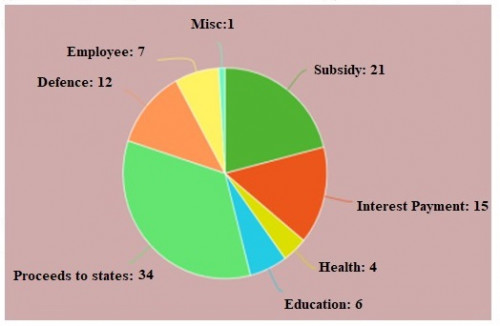
SSC CPO 2020198)The following pie chart shows percentage expenditure of a country on different heads. The total expenditure is Rs. 1,680 (in billions). Study the chart and answer the question.
The total amount of expenditure for education and Health (in billions Rs.) is:
168
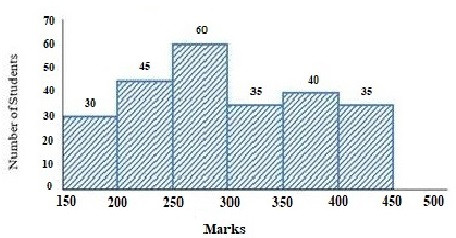
SSC CPO 2020199)Study the given histogram that shows the marks obtained by students in an examination and answer the question that follows.
If the total marks obtained by students be represented as a pie chart, then the central angle corresponding to marks 250 or more but less than 300 is:
(correct to the nearest degree)
 in the interval (60 - 70) km/h is what percentage less than the number of cars with speed (km/h) in the interval (70 - 80) km/h? (correct to one decimal place))
 in the interval (60 - 70) km/h is what percentage less than the number of cars with speed (km/h) in the interval (70 - 80) km/h? (correct to one decimal place)**%0D%0AA%29 5.6%%0D%0AB%29 8.6%%0D%0AC%29 7.5%%0D%0AD%29 5.9% %0D%0AClick Link for Answer)
. Study the chart and answer the question.<br><img class="img-fluid pr-2 py-1 qImg extra-img" src="https://scorekhel.com/storage/practiceQuestion/Que9047/eng/extra-image.jpg" /><br> The total amount of expenditure for education and Health (in billions Rs.) is:)
. Study the chart and answer the question.<br><img class=\"img-fluid pr-2 py-1 qImg extra-img\" src=\"https://scorekhel.com/storage/practiceQuestion/Que9047/eng/extra-image.jpg\" /><br> The total amount of expenditure for education and Health (in billions Rs.) is:**%0D%0AA%29 84%0D%0AB%29 168%0D%0AC%29 126%0D%0AD%29 186 %0D%0AClick Link for Answer)
)
**%0D%0AA%29 88°%0D%0AB%29 68°%0D%0AC%29 128°%0D%0AD%29 188° %0D%0AClick Link for Answer)
88°
SSC CPO 2020200)The following pie chart shows the percentage expenditure of a country on different heads. The total expenditure is Rs. 1,680 (in billions). Study the chart and answer the question.
The amount of expenditure on Defence is what percentage more than the expenditure on Education?
. Study the chart and answer the question.<br><img class="img-fluid pr-2 py-1 qImg extra-img" src="https://scorekhel.com/storage/practiceQuestion/Que9047/eng/extra-image.jpg" /><br>The amount of expenditure on Defence is what percentage more than the expenditure on Education?)
. Study the chart and answer the question.<br><img class=\"img-fluid pr-2 py-1 qImg extra-img\" src=\"https://scorekhel.com/storage/practiceQuestion/Que9047/eng/extra-image.jpg\" /><br>The amount of expenditure on Defence is what percentage more than the expenditure on Education?**%0D%0AA%29 150%%0D%0AB%29 125%%0D%0AC%29 50%%0D%0AD%29 100% %0D%0AClick Link for Answer)
100%