objective Ques (356 results)
1)Study the graph and answer the question that follows. What is the ratio of the total number of workers whose daily wages are less than ₹500 to the total number of workers whose daily wages are ₹600 and above?
SSC CGL 2019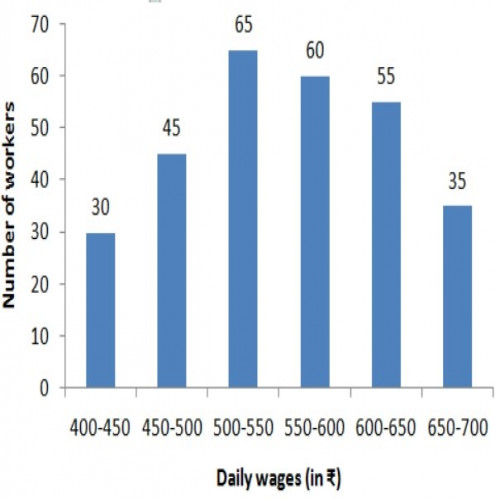
5 : 6
Total number of workers whose daily wages are less than ₹500 = 30 + 45 = 75
Total number of workers whose daily wages are ₹600 and above = 55 + 35 = 90
ratio of the total number of workers whose daily wages are less than ₹500 to the total number of workers whose daily wages are ₹600
and above = 75 : 90 = 5 : 6
2)The given graph shows the weights of students in a school on a particular day. Study the graph and answer the question.
The number of students weighing less than 50 kg is what percent less than the number of students weighing 55 kg or more?
SSC CGL 2019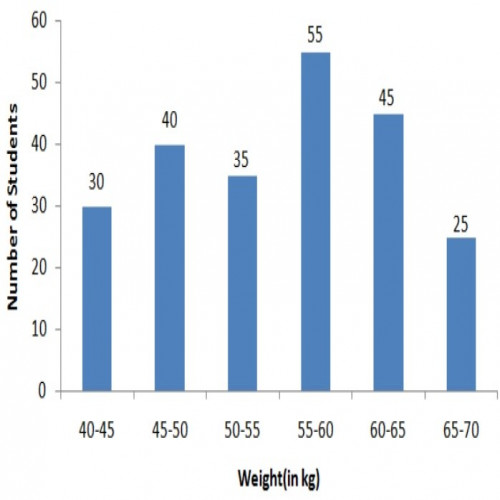
44
3)The given graph shows the marks obtained by students in an examination. Study the graph and answer the question. The number of students who obtained less than 300 marks is what percent more than the number of students who obtained 350 or more marks?
SSC CGL 2019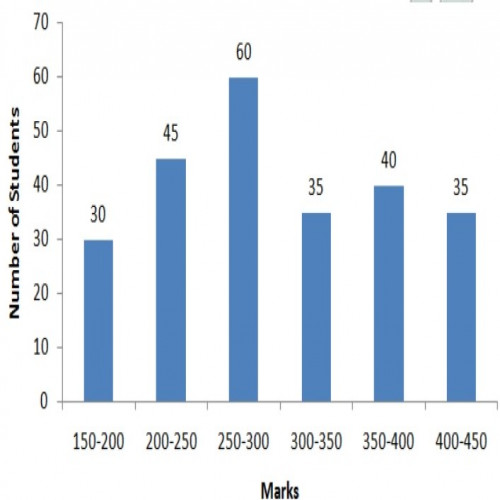
80%
4)The following table shows the imports and exports (in Rs.crore) of a country over 4 years (2016 to 2019).
The average trade balance (in Rs.crores) is:
SSC CGL 2020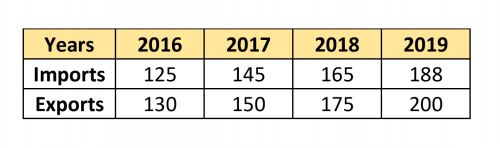
8
Trade balance (in Rs.crores) in 2016 = 130 - 125 = 5;
Trade balance (in Rs.crores) in 2017 = 150 - 145 = 5;
Trade balance (in Rs.crores) in 2018 = 175 - 165 = 10;
Trade balance (in Rs.crores) in 2019 = 200 - 188 = 12;
Average trade balance (in Rs.crores) = \({5 + 5 +10 + 12\over4}= {32\over4}=Rs.8 \) crores
5)Study the following table and answer the question. Expenditures of a Company (in Lakh Rupees) per annum over the given years.
Total expenditure on all the items in 2014 was approximately what percent of the total expenditure in 2018?
SSC CGL 2020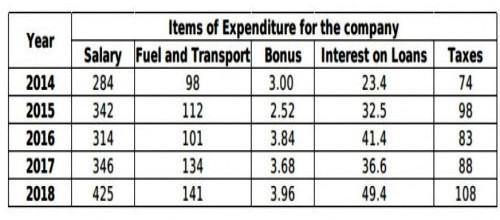
66.32%
Total expenditure on all the items in 2014 = 284 + 98 + 3 + 23.4 + 74 = 482.4;
Total expenditure on all the items in 2018 = 425 + 141 + 3.96 + 49.4 + 108 = 727.36;
Required percentage =\( \frac{482.4}{727.36} \times 100\) = 66.32%
6)The following table gives the frequency of vowels used in the page of a book.
As per the given data, which vowels occur less than 80 times?SSC CGL 2020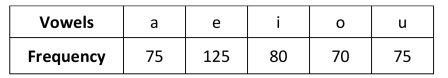
a, o, u
According to the given data, vowels which are used less than 80 times a, o, u.
7)The following table shows the income(in rupees) for a particular month, together with their source, in respect of 5 employees (A, B, C, D and E).
For employee D, the income from overtime is what percentage of his total income?
SSC CGL 2020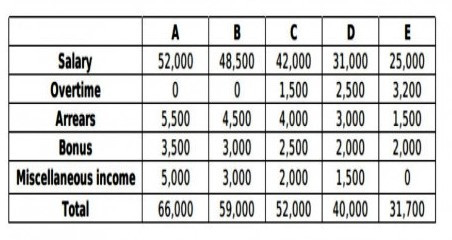
6.25%
Income of employee D from overtime = Rs. 2500; Total income = Rs. 40000; Required percent = \({2500\over 40000}\times100\) = 6.25%
8)As per data shown in the following table, what is the percentage of students who got less than 50 marks?
SSC CGL 2020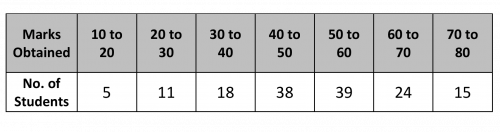
48%
Number of students who got less than 50 marks = 5 + 11 + 18 + 38 = 72;
Total number of students = 5 + 11 + 18 + 38 + 39 + 24 + 15 = 150;
Percentage of students who got less than 50 marks = \({72\over150}\times100\) = 48%
9)The following table shows the number of students enrolled in different streams in a particular college.
The ratio of the number of girls studying Arts to the number of girls studying in all other streams is:
SSC CGL 2020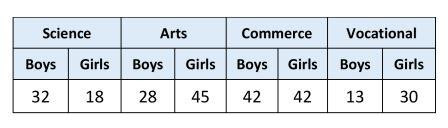
1 : 2
Number of girls studying Arts = 45;
Number of girls studying in all other streams = 18 + 42 + 30 = 90;
The ratio of the number of girls studying Arts to the number of girls studying in all other streams = 45 : 90 = 1 : 2
10)The following table shows the items of expenditure of a company(in ₹ lakh per annum), from 2015 to 2019.
What is the average amount of interest per year which the company had to pay during this period?
SSC CGL 2020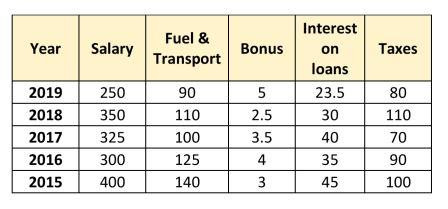
Rs. 34.7 lakh
Average amount of interest per year which the company had to pay during this period = \(\frac{23.5 + 30 + 40 + 35 + 45}{5} \)= 173.5/5 = 34.7 lakh