objective Ques (356 results)
31)The line graph shows the production (in tonnes) and the sales (in tonnes) of a company.
What percentage (approximately) of the total production of the company is the total sales of the company in all the years together? (correct to 2 decimal places)
SSC CHSL 2021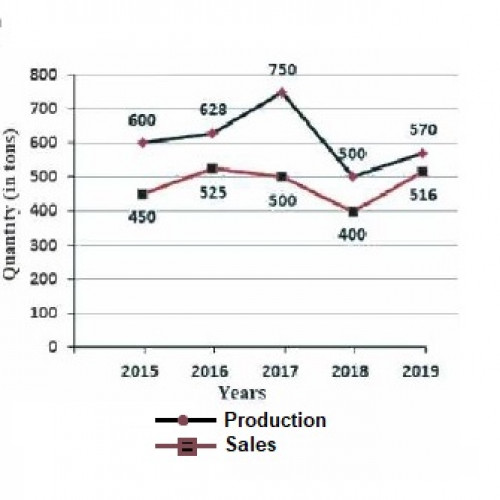
78.44
32)Study the following graph and answer the question the follows.
Marks scored by five students A, B, C, D and E in three subjects (Maths, English and Physics). Total marks for each subject are 100.
What is the percentage marks obtained by E in all three subjects together? (Assuming maximum marks for each subject are 100.)SSC CHSL 2021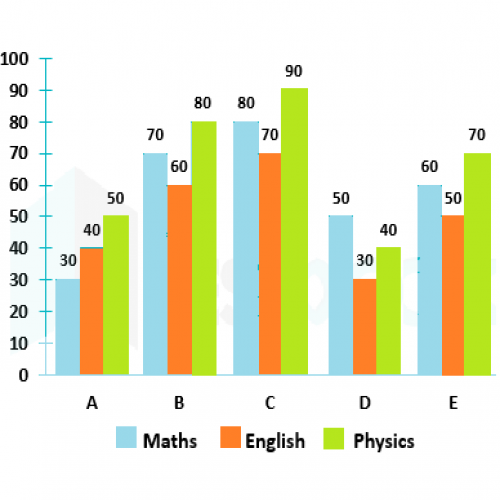
60
33)Study of given bar graph and answer the question that follows.
The given bar graph represents the Sales Turnover (in Rs. crore) of five automobile companies A, B, C, D and E during 2014-2015 and 2015-2016. The X-axis represents the Companies, and the Y-axis shows the Sales Turnover (in Rs. crore).
(The data shown here is only for mathematical exercise. They do not represent the actual figure of the company.)
If there was an increase of 25% in the average of the sales turnover of all the companies together in 2014-2015 from that in 2013-2014, then what was the average (in Rs.crore, up two decimal places) of the sales turnover of all the companies together in 2013-2014?SSC CHSL 2021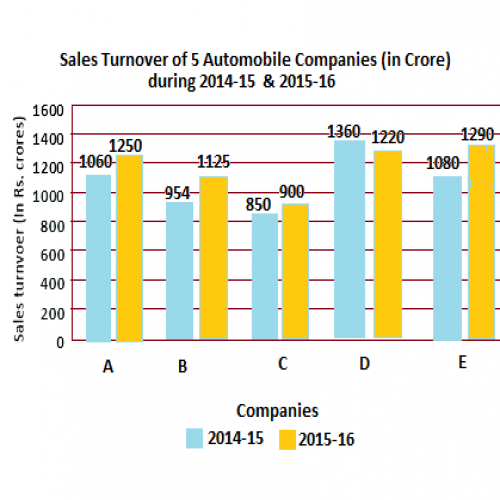
848.64
34)Students of Primary, Middle, Secondary and Sr. Secondary classes collected donation for a Relief Fund as shown in the pie chart. If the donation collected from Middle classes was Rs.6,750, then what would be the total amount of money collected by Secondary and Sr.Secondary classes?
SSC CHSL 2021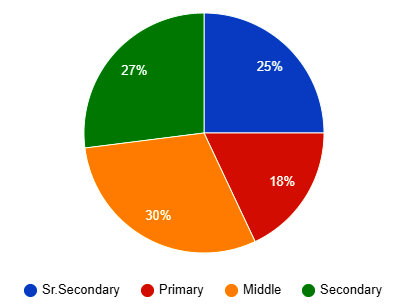
Rs.11,700
35)The given pie charts represent the distribution of candidates who enrolled for a bank clerical examination and the candidates (out of those enrolled) who passed the examination, from five different institutes P, Q, R, S and T. Study the pie charts and answer the question that follows.
The average number of candidates passed from institutes P and Q together is what percentage of the total number of candidates enrolled from institutes P and Q together?
SSC CHSL 2021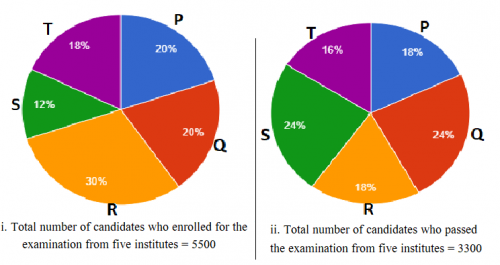
25.2%
36)The given bar graph indicates the production of sugar (in lakh tonnes) by three different sugar companies P, Q and R from the year 2015 to 2019. Study the bar graph and answer the question that follows.
Production of sugar by companies P, Q and R from 2015 to 2019The percentage increase in the production of sugar by company P in 2019 as compared to 2015 is:
SSC CHSL 2021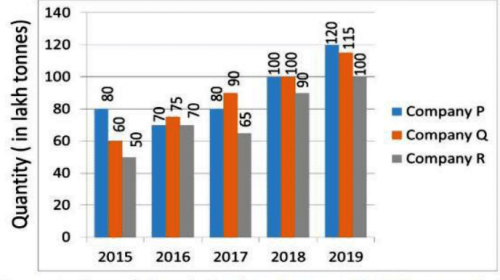
50%
37)Study the given bar chart and answer the question that follows.
The bar chart shows the production of medicines by a company (in 1000 tonnes) over six years 2010 to 2015.If in each of the following years, the percentage increase in production as compared to the previous year is taken, then the ratio for increase production of the year 2011 to increase production of year 2015 is:
SSC CHSL 2021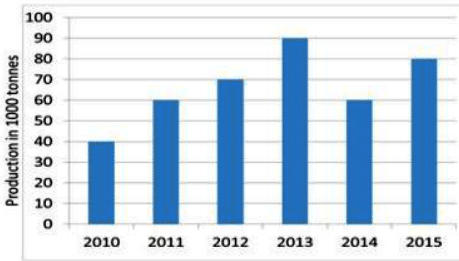
3 ∶ 2
38)Study the following bar graph and answer the question that follows.
In how many years was the export more than the average for the given period?
SSC CHSL 2021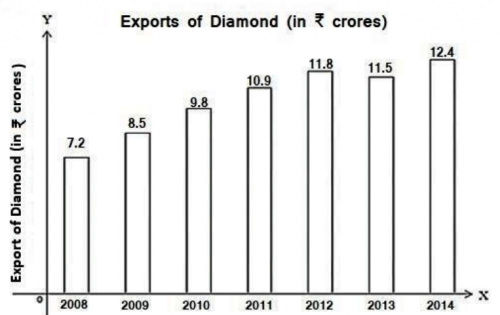
4
39)Study the histogram that shows the marks obtained by students in an examination and answer the question that follows.
By what percentage is the number of students who obtained marks between 200 and 300 more than the number of students who obtained 350 or more marks?
SSC CHSL 2021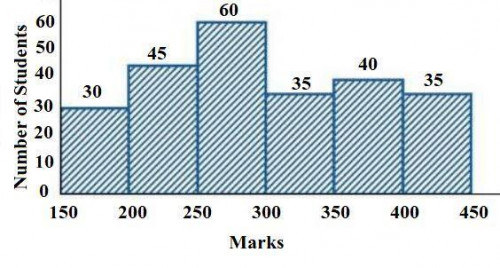
40%
40)Study the given graph and answer the question the follows.
What is the ratio of the total production of sugar in 2014 and 2018 to the total export in 2015 and 2019?
SSC CHSL 2021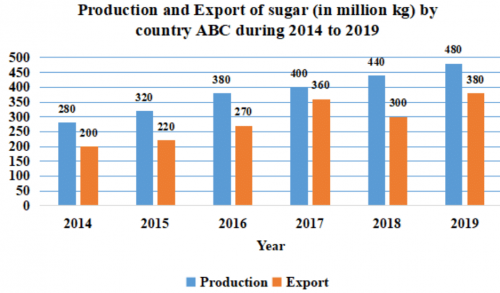
6 : 5