objective Ques (356 results)
SSC CGL 2022321)The table given below shows the number of bicycle sold by six companies.
What are the ratio of number of bicycle sold by B to the number of bicycle sold by D?
Companies
Bicycle
A
60
B
90
C
120
D
165
E
180
F
120
6 : 11
SSC CGL 2022322)The following table gives the subscription of different schemes of a Mutual Fund Company over the months.
(Rupees in crores)
What is the difference in the subscription of scheme X between December and February?
Months
Schemes
Total
V
W
X
Y
Z
September
200
70
30
290
10
600
October
120
130
70
150
290
760
November
45
35
25
125
160
390
December
160
110
40
115
130
555
January
80
90
70
100
140
480
February
130
150
30
40
390
740
10 crores
323)The pie chart given below shows the production of 6 different factories. The total production of all these 6 factories are 22000. The production of a particular factory is shown as a percent of total production of all these 6 factories.
P1 = The value of average production of A, C, D and F.
P2 = The difference between the production of B and E.
What is the value of (P1 + P2)?SSC CGL 2022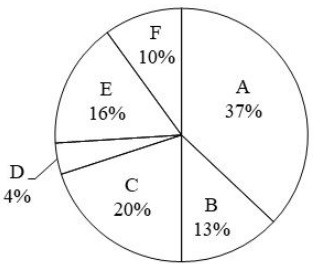
4565
324)The pie chart given below shows the sales of 7 different companies. The total sales of all these 7 companies are 2880. The sale of a particular company is shown in terms of degree with respect to the total sales of all these 7 companies.
The average sales of G and H is how much percent more than the average sales of D and I?SSC CGL 2022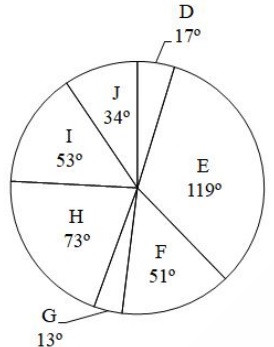
22.86 percent
SSC CGL 2022325)The table given below shows the cost price and selling of four different articles.
What is the difference between the average selling price and average cost price of all the articles?
Articles
Cost price
Selling price
J
650
750
K
370
450
L
450
650
M
590
650
110
326)The pie chart given below shows the number of boys in 8 schools. The total number of boys in all these 8 school is 5000. Number of boys in a particular school is shown as a percent of total number of boys in all these 8 schools.
What is the ratio of total number of boys in B, D and E to the total number of boys in A, C and F?SSC CGL 2022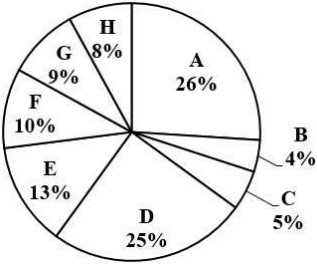
37 ∶ 57
327)The pie chart given below shows the number of car sold by 8 different companies. The total number of car sold by all these 8 companies are 5,000. Number of cars sold by a particular company is shown as a percent of total number of cars sold by all these 8 companies.
What is the ratio of total central angle formed by sector R and S to the total central angle formed by sector U and V?SSC CGL 2022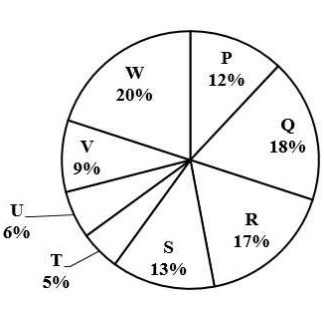
2 ∶ 1
SSC CGL 2022328)The table given below shows the sales turnover of 5 different companies.
What is the difference between the sales turnover of company H and F?
Company
Sales turnover
E
270
F
230
G
350
H
400
I
300
170
329)The following bar chart shows the export of a certain commodity P in crore rupees between 2014 and 2020.
For how many years, there was less export of P than the average export of P?SSC CGL 2022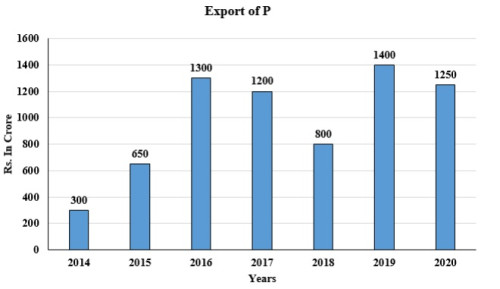
3
330)The following line graph displays the ratio of exports to imports (in terms of money in ₹ crores) of company A from 2010 to 2015.
Study the graph carefully and answer the question based on the given line graph.
In how many years, the export of company A was more than the company's import?SSC CGL 2022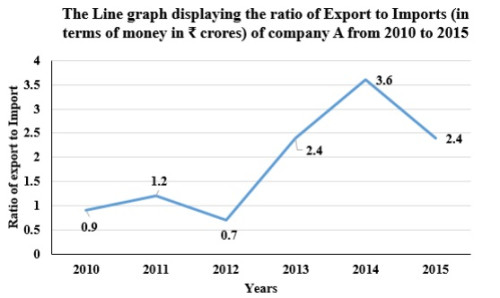
Four