objective Ques (356 results)
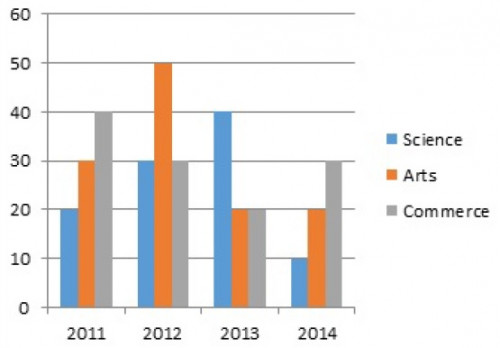
SSC CPO 2020221)The number of students in Class XI in Science, Arts and Commerce streams of a school over a period of 4 years (2011-2014) has been depicted through the bar chart given below.
What is the average number of Arts students in the given class over the given period of 4 years?
30
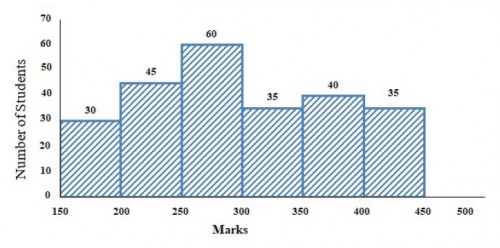
SSC CPO 2020222)Study the given histogram that shows the marks obtained by students in an examination and answer the question that follows.
The number of students who obtained less than 250 marks is what percent more than the number of students who obtained 400 or more marks?
(correct to one decimal place)
114.3%
SSC CPO 2020223)The number of students in Class XI in Science, Arts and Commerce streams of a school over a period of 4 years (2011-2014) has been depicted through the bar chart given below.
What is the difference between the averages of the number of Science and Commerce students in the given class over the given period of 4 years?
5
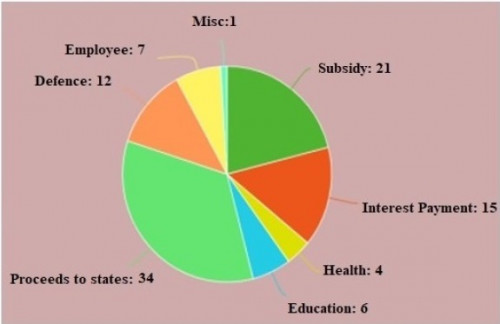
SSC CPO 2020224)The following pie chart shows percentage expenditure of a country on different heads. The total expenditure is Rs. 1,680 (in billions). Study the chart and answer the question.
The central angle of the sector representing expenditure on Interest payment is:
54°
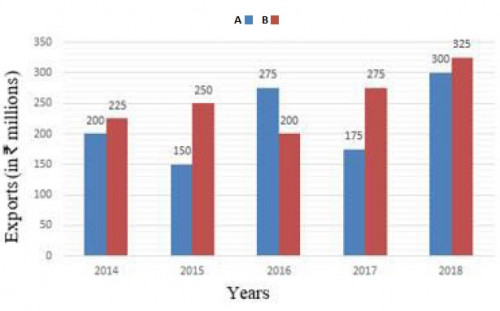
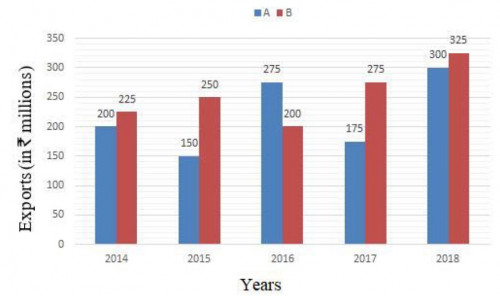
SSC CGL 2022225)The following bar graph shows exports of cars of type A and B (in Rs. millions) from 2014 to 2018.
What is the ratio of the total exports of cars of type A in 2014 and 2017 to the total exports of cars of type B in 2015 and 2016?
5 : 6
SSC CGL 2022226)The given histogram represents the marks of students in Mathematics test of a certain class.
The total number of students is 350.
Study the graph and answer the question that follows.
What is the ratio of the total number of students who scored 140 marks and above to the total number of students who scored marks between 60 to 120?
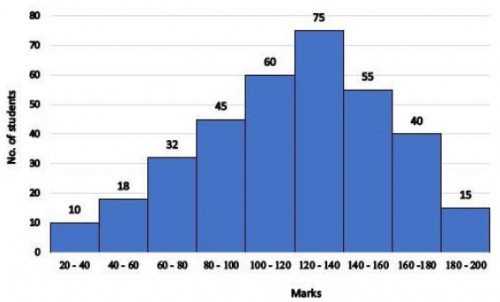
110 : 137
SSC CGL 2022227)The number of cars passing the road near a colony from 6 am to 12 noon has been shown in the following histogram.
What is the ratio of the number of cars passed between 6 am and 8 am to the number of cars passed between 9 am and 11 am?
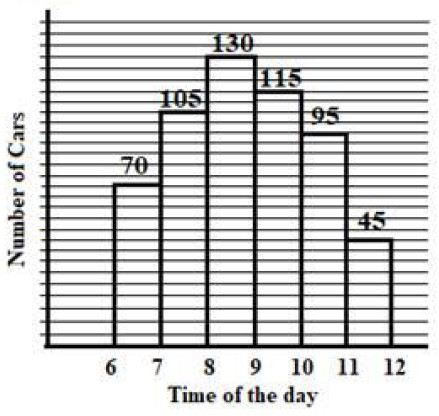
5 : 6
SSC CGL 2022228)Monthly expenditure of a family on different heads is shown in the following pie chart.
The amount spent on Children Education, Transport and Rent is what percentage of the total earnings?
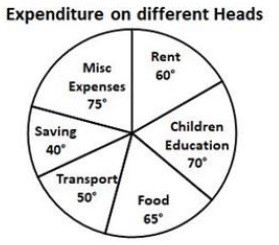
50%
SSC CGL 2022229)Study the given bar graph and answer the question that follows.
The bar graph shows the exports of cars of type A and B (in Rs. millions) from 2014 to 2018.
In which year were the exports of cars of type A Rs. 55 million less than the average exports (per year) of cars of type B over the five years?
 has been depicted through the bar chart given below.<br><img class="img-fluid pr-2 py-1 qImg extra-img" src="https://scorekhel.com/storage/practiceQuestion/Que9467/eng/extra-image.jpg" /><br> What is the average number of Arts students in the given class over the given period of 4 years?)
 has been depicted through the bar chart given below.<br><img class=\"img-fluid pr-2 py-1 qImg extra-img\" src=\"https://scorekhel.com/storage/practiceQuestion/Que9467/eng/extra-image.jpg\" /><br> What is the average number of Arts students in the given class over the given period of 4 years?**%0D%0AA%29 32%0D%0AB%29 35%0D%0AC%29 30%0D%0AD%29 25 %0D%0AClick Link for Answer)
)
**%0D%0AA%29 114.3%%0D%0AB%29 100%%0D%0AC%29 150%%0D%0AD%29 175.8% %0D%0AClick Link for Answer)
 has been depicted through the bar chart given below.<br><img class="img-fluid pr-2 py-1 qImg extra-img" src="https://scorekhel.com/storage/practiceQuestion/Que9467/eng/extra-image.jpg" /><br> What is the difference between the averages of the number of Science and Commerce students in the given class over the given period of 4 years?)
 has been depicted through the bar chart given below.<br><img class=\"img-fluid pr-2 py-1 qImg extra-img\" src=\"https://scorekhel.com/storage/practiceQuestion/Que9467/eng/extra-image.jpg\" /><br> What is the difference between the averages of the number of Science and Commerce students in the given class over the given period of 4 years?**%0D%0AA%29 10%0D%0AB%29 8%0D%0AC%29 12%0D%0AD%29 5 %0D%0AClick Link for Answer)
. Study the chart and answer the question.<br><img class="img-fluid pr-2 py-1 qImg extra-img" src="https://scorekhel.com/storage/practiceQuestion/Que9439/eng/extra-image.jpg" /><br> The central angle of the sector representing expenditure on Interest payment is:)
. Study the chart and answer the question.<br><img class=\"img-fluid pr-2 py-1 qImg extra-img\" src=\"https://scorekhel.com/storage/practiceQuestion/Que9439/eng/extra-image.jpg\" /><br> The central angle of the sector representing expenditure on Interest payment is:**%0D%0AA%29 72°%0D%0AB%29 108°%0D%0AC%29 90°%0D%0AD%29 54° %0D%0AClick Link for Answer)
 from 2014 to 2018.<br><img class="img-fluid pr-2 py-1 qImg extra-img" src="https://scorekhel.com/storage/practiceQuestion/Que10059/eng/extra-image.jpg" /><br>What is the ratio of the total exports of cars of type A in 2014 and 2017 to the total exports of cars of type B in 2015 and 2016?)
 from 2014 to 2018.<br><img class=\"img-fluid pr-2 py-1 qImg extra-img\" src=\"https://scorekhel.com/storage/practiceQuestion/Que10059/eng/extra-image.jpg\" /><br>What is the ratio of the total exports of cars of type A in 2014 and 2017 to the total exports of cars of type B in 2015 and 2016?**%0D%0AA%29 5 : 6%0D%0AB%29 3 : 2%0D%0AC%29 10 : 9%0D%0AD%29 11 : 10 %0D%0AClick Link for Answer)
 from 2014 to 2018.<br><img class="img-fluid pr-2 py-1 qImg extra-img" src="https://scorekhel.com/storage/practiceQuestion/Que10153/eng/extra-image.jpg" /><br> In which year were the exports of cars of type A Rs. 55 million less than the average exports (per year) of cars of type B over the five years?)
 from 2014 to 2018.<br><img class=\"img-fluid pr-2 py-1 qImg extra-img\" src=\"https://scorekhel.com/storage/practiceQuestion/Que10153/eng/extra-image.jpg\" /><br> In which year were the exports of cars of type A Rs. 55 million less than the average exports (per year) of cars of type B over the five years?**%0D%0AA%29 2017%0D%0AB%29 2016%0D%0AC%29 2015%0D%0AD%29 2014 %0D%0AClick Link for Answer)
2014
SSC CGL 2022230)The given bar graph shows export of cars of type A and B(in Rs. millions) from 2014 to 2018. Study the graph and answer the question that follows. Exports of Cars of Type A and B (in Rs. millions) from 2014 to 2018
The total exports of cars of type B in 2014 to 2017 is what per cent more than the total exports of cars of type A in 2015 to 2018? (correct to one decimal place)
 from 2014 to 2018. Study the graph and answer the question that follows. Exports of Cars of Type A and B (in Rs. millions) from 2014 to 2018 <br><img class="img-fluid pr-2 py-1 qImg extra-img" src="https://scorekhel.com/storage/practiceQuestion/Que10153/eng/extra-image.jpg" /><br> The total exports of cars of type B in 2014 to 2017 is what per cent more than the total exports of cars of type A in 2015 to 2018? (correct to one decimal place))
 from 2014 to 2018. Study the graph and answer the question that follows. Exports of Cars of Type A and B (in Rs. millions) from 2014 to 2018 <br><img class=\"img-fluid pr-2 py-1 qImg extra-img\" src=\"https://scorekhel.com/storage/practiceQuestion/Que10153/eng/extra-image.jpg\" /><br> The total exports of cars of type B in 2014 to 2017 is what per cent more than the total exports of cars of type A in 2015 to 2018? (correct to one decimal place)**%0D%0AA%29 5.6%%0D%0AB%29 4.9%%0D%0AC%29 6.5%%0D%0AD%29 7.2% %0D%0AClick Link for Answer)
5.6%