objective Ques (356 results)
SSC CGL 2022311)The table given below shows the number of spoon manufactured by five factories.
What are the ratio of number of spoon manufactured by P to the number of spoon manufactured by R?
Factory Spoon P 100 Q 200 R 150 S 50 T 250
2 : 3
312)The following bar graph shows the sales of books (in thousands) from six branches of a publishing company during two consecutive years 2018 and 2019.
What is the ratio of the total sales of the first branch for for both years to the total sales of the fourth branch for both years?SSC CGL 2022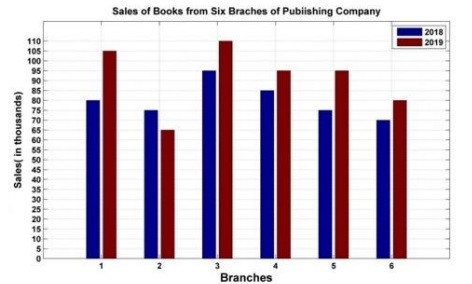
37 ∶ 36
313)Study the given chart and answer the following question.
What is the central angle corresponding to the production steel by Kerala?SSC CGL 2022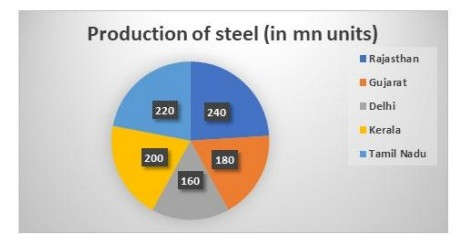
72°
SSC CGL 2022314)The following table shows the number of different items in different shops and their respective selling prices per unit.
Find the percentage of total revenue which comes from Cooler from shop E, considering all given items are being sold from shop E and from all the given shops only given three items are being sold. (Rounded off to three decimal places)
Shops
Total No. of Items
AC ∶ Cooler ∶ Fan
Selling Price per unit
Cooler
AC
Fan
A
5000
4 ∶ 5 ∶ 1
8000
25000
8500
B
1800
3 ∶ 2 ∶ 4
10000
20000
16000
C
3400
6 ∶ 4 ∶ 7
6000
42000
15000
D
3600
4 ∶ 2 ∶ 3
12000
32000
8000
E
4000
5 ∶ 1 ∶ 4
8000
26500
12200
F
1210
2 ∶ 4 ∶ 5
11000
28000
11100
4.226%
SSC CGL 2022315)The following table shows the marks (in percentages) obtained by six students in four different subjects in an examination. Maximum marks in each subject are 100.
Answer the following question based on the table:
Student
SUBJECT
SST
PHYSICS
CHEMISTRY
MATHS
A
92
90
90
80
B
90
80
85
85
C
80
80
65
70
D
85
80
82
75
E
80
75
75
85
F
90
90
90
85
What is the number of students whose overall percentage obtained is 80% and above?
4
SSC CGL 2022316)The table given below shows the number of persons participating in a survey from 6 different states.
What is the ratio of number of person participating in a survey from state S3 to the number of person participating in a survey from state S4?
States Persons S1 100 S2 200 S3 400 S4 500 S5 600 S6 800
4 ∶ 5
317)The pie chart given below shows the number of bike sold by 8 different companies. The total number of bike sold by all these 8 companies are 2000. Number of bikes sold by a particular company is shown as a percent of total number of bike sold by all these 8 companies.
What is the difference between the average number of bikes sold by P, Q, R and S and the average number of bikes sold by T, U, V and W?SSC CGL 2022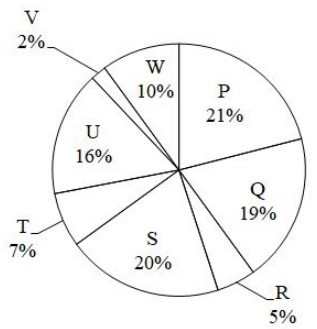
150
318)The bar graph shows the percentage distribution of the expenditure of a company under various expense heads during 2003.
If the interest on loans amounted to ₹3.15 crores, then the total amount of expenditure on salary, taxes and infrastructure is:SSC CGL 2022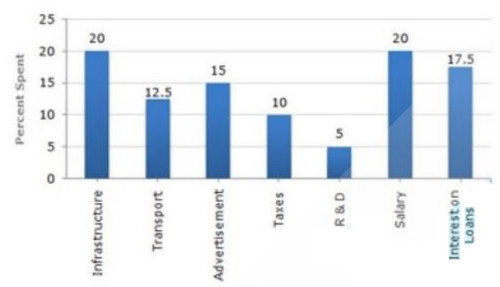
9 crores
SSC CGL 2022319)The table given below shows the income of two companies C1 and C2 in 6 years.
Which of the following statement is NOT correct?
Company
Year
C1
C2
P
750
850
Q
200
250
R
330
350
S
550
650
T
530
270
U
370
390
I. The income of C1 in year P is 33.33 percent of the income of C2 in year Q.
II. The average income of C1 and C2 in year T is 400.
Only I
SSC CGL 2022320)Study the following table and answer the question below.
Find the ratio of the number of female students who opted biology in school B and school D.
School name
Total number of students enrolled
Percentage of enrolled students, opted Biology
Ratio of male to female students who opted Biology
A
900
30
7 ∶ 8
B
400
36
5 7
C
1000
24
5 19
D
800
18
3 9
7 : 9