objective Ques (356 results)
61)The pie chart shows the money spent by Aditya through credit cards of different banks. The total money spent by him through the credit cards in a year is ₹3,60,000.
What is the maximum amount spent by Aditya through the credit card of one bank ?SSC CHSL 2021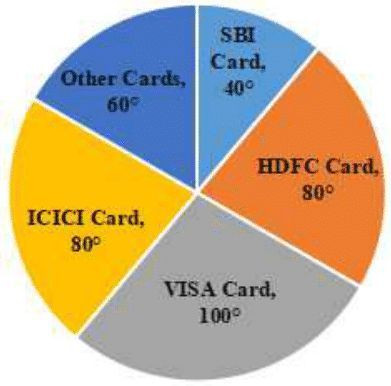
1,00,000
62)Study the given bar graph and answer the question that follows.
A soft drink company prepares drinks of three different flavours A, B and C. The bar graph shows the production of three flavours over a period of five years from 2010 to 2014.
For which of the following years, is the percentage of the rise in production compared to its previous year the maximum with respect to flavour C?SSC CHSL 2021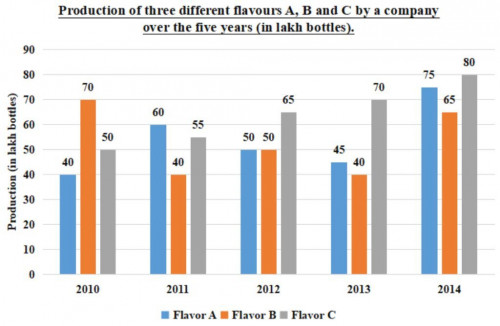
2012
63)Study the given bar graph and answer the question that follows.
In how many of the given years was the production of organic fertilizers more than the average production of organic fertilizers in the given years?SSC CHSL 2021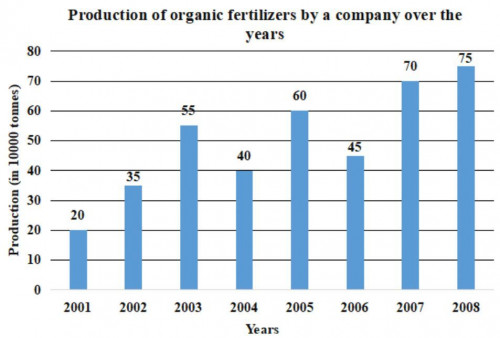
4
64)Study the line graph and answer the question that follows.
The line graph represents the number of vehicles (in thousands) manufactured by two automobile companies A and B over the years from 2010 to 2015. The X-axis represents the years and the Y-axis represents number of vehicles in thousands.
(The data shown here is only for mathematical exercise. They do not represent the actual figures of the country.)
The average value of the vehicles manufactured by Company A is what per cent of the average value of the vehicles manufactured by Company B during 2010 to 2015?SSC CHSL 2021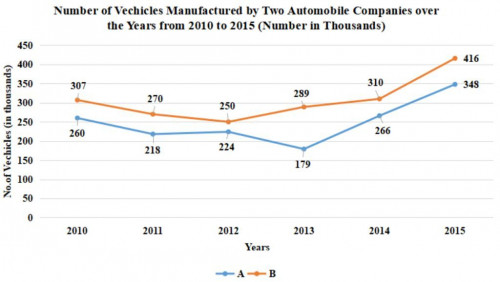
81.2
65)Study the given pie-chart and answer the question that follows.
The pie-chart represents the consumption of fuel (in million litres) by various modes of transport of a country X in the year 2015. The total consumption of fuel by various modes of transport of the country is 800 million litres.
(The data shown here is only for mathematical exercise. They do not represent the actual figures of the country.)
The fuel consumed by light vehicles is approximately what percentage of the combined consumption of fuel for aviation and waterways?SSC CHSL 2021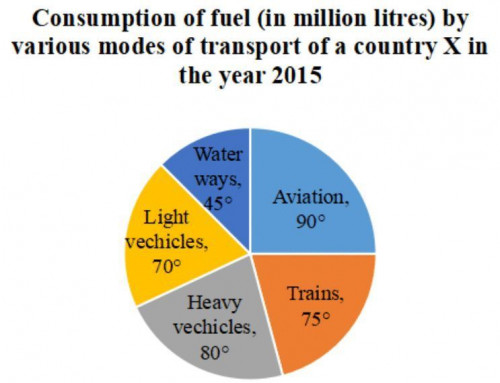
52
66)Study the given bar graph and answer the question that follows.
A tea plantation company produces three varieties of tea - black tea, green tea and herbal tea. The production of three varieties (in million tonnes) over a period of six years from 2014 to 2019, has been shown in the bar graph here. The X-axis represents the years and the Y-axis displays the production of the three varieties in million tonnes.
The average value of the combined production of black tea and herbal tea from 2014 to 2019 is what percent (up to 1 decimal place) of the average value of the production of green tea during the same period?SSC CHSL 2021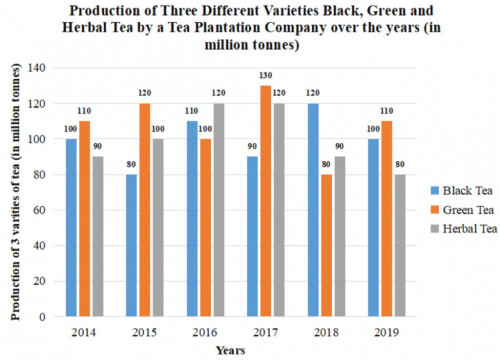
92.3
67)The given bar graph shows the production of table fans in a factory during one week. Study the bar graph and answer the question that follows.
The production of fans on Tuesday is what percentage of the total production of fans during the week?SSC CHSL 2021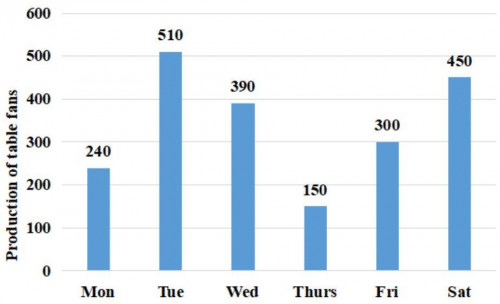
25%
SSC CHSL 202168)Study the given table and answer the question that follows.
In the table, the annual consumption (in hundred tonnes) of coffee in five states (A, B, C, D and E) across six years (2014 to 2019) is given.
State
/ Year
A
B
C
D
E
2014
112
130
136
105
117
2015
122
138
150
140
120
2016
124
134
142
144
132
2017
132
154
198
149
133
2018
135
148
187
151
145
2019
153
136
198
150
187
By what percentage is the total consumption of coffee in state D from 2014 to 2016 less than the total consumption of coffee in states A, B, C, and E in 2015 (correct to one decimal place)?
26.7%
69)The histogram shows the marks scored by 40 students in test with maximum 30 marks.
What is the ratio of the number of students who scored marks in the class intervals 10 - 15 and 15 - 20 taken together to that of the students in the class intervals 5 - 10 and 25 - 30 taken together?SSC CHSL 2021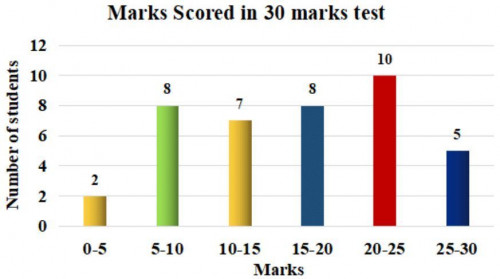
15 ∶ 13
70)Study the Grapy & Answer the Question:
The ratio of the total number of computers of type A sold in February, April and June to the total number of computers of type B sold in April and May is:SSC CHSL 2021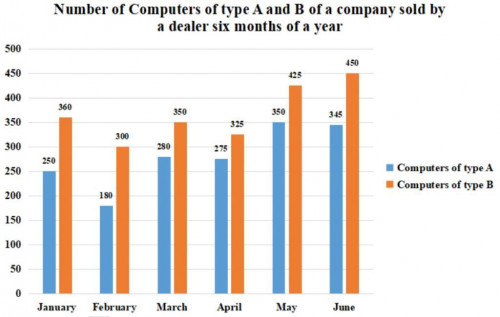
16 ∶ 15