objective Ques (356 results)
341)The given bar diagram represents the number of persons who have taken an insurance policy on the y-axis, and the year of purchase of the insurance policy on the x-axis.
What is the average number of persons who have taken the insurance policy, excluding in the year 2012?SSC CGL 2022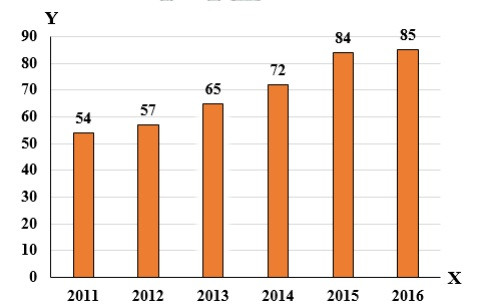
72
SSC CGL 2022342)The table given below shows the budget allocation for education in five states in a year.
What is the total budget allocation for education in all the states?
States Budget allocation D 225 E 75 F 250 G 425 H 535
1510
SSC CGL 2022343)The table given below shows the GDP of two countries in different five years.
Country Years A B Y1 175 285 Y2 200 300 Y3 150 125 Y4 75 85 Y5 50 95
K1 = The value of average GDP of country A in all the 5 years.
K2 = The value of average GDP of country B in all the 5 years.
What is the value of (K1 + K2)?
308
SSC CGL 2022344)The following table shows the marks distribution among the students in a class.
How many students scored marks between 20 and 30?
Marks No. of Students Less than 10 2 Less than 20 5 Less than 30 6 Less than 40 8 Less than 50 10
1
SSC CGL 2022345)The table given below shows the number of people in different states.
What is the average number of people in all the states?
State Number of people F 474 G 500 H 444 I 495 J 580
498.6
346)Study the given graph and table and answer the following question.
Data of different states regarding population of states in the year 1998
What was the number of males in Bihar in the year 1998?SSC CGL 2022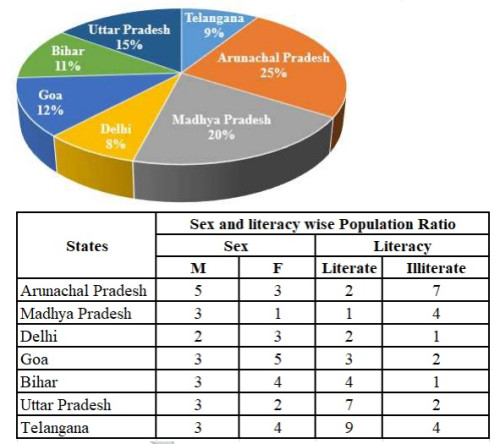
15,44,400
SSC CGL 2022347)The following table shows the exports of three companies P, Q and R from 2015 to 2019.
Which of the following years has the highest total exports from the three companies together?
Company/ years ⇒ 2015 2016 2017 2018 2019 P 2000 1000 2000 3000 4000 Q 4000 5000 4000 5000 3000 R 3000 2000 4000 4000 5000
2019
348)Study the given graph and answer the following question.
If 35% of the lecturers recruited in state B in the year 2021 were male, what was the number of females in state B in that year?SSC CGL 2022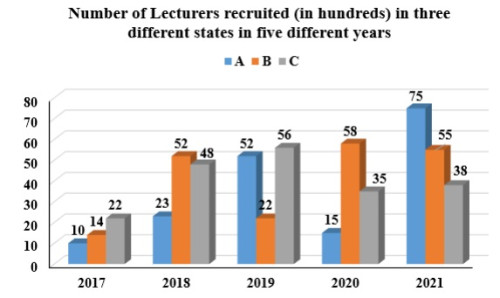
3575
SSC CGL 2022349)The table given below shows the number of tractor sold by two companies.
Number of tractor T5 sold by both companies is how much percent more than the number of tractor T2 sold by both companies?
Company Tractor P Q T1 60 90 T2 40 50 T3 80 100 T4 90 120 T5 110 150
188.88 percent
SSC CGL 2022350)The table given below shows the number of scissor sold by five shopkeepers.
What are the ratio of number of scissor sold by R to the sold by S?
Shopkeepers Scissors P 30 Q 50 R 45 S 25 T 70
9 : 5