objective Ques (356 results)
SSC CGL 2022331)The table given below shows the foreign trade by two countries in 5 different years.
What is the total foreign trade by country M in all the 5 years?
Country
Years
L
M
Y1
250
125
Y2
230
185
Y3
155
275
Y4
145
255
Y5
115
170
1010
332)The pie-chart shows marks of a student in different subjects out of 100.The marks scored in Hindi and Mathematics are more than the marks scored in English and Science by:
SSC CGL 2022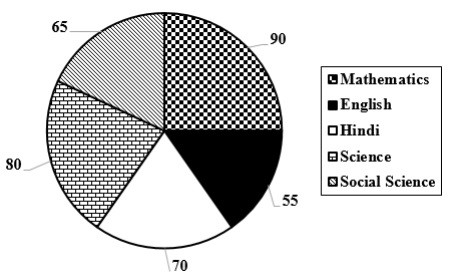
25
SSC CGL 2022333)The table given below shows the sales turnover of 5 different companies.
The sales turnover of company A is what percent of the sales turnover of company C?
Company Sales turnover A 120 B 80 C 200 D 250 E 150
60 percent
334)The pie chart given below shows the production of 6 different factories. The total production of all these 6 factories is 15000. The production of a particular factory is shown as a percent of total production of all these 6 factories.
J1 = The value of average production of factories F3 and F6.
J2 = The difference between the production of factory F1 and F4. What is the value of (J2 - J1)?SSC CGL 2022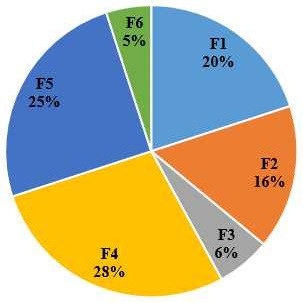
375
335)In the following bar diagram, there are 5 companies A, B, C, D and E. The diagram shows the demand of a product and its production the above five companies.
If x% of the demand of the product by Company C is equal to that of the Company B, then find the value of x.SSC CGL 2022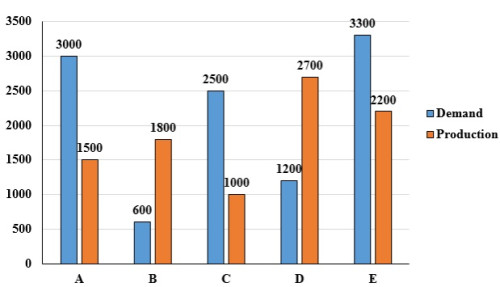
24
336)The number of mobile sim-cards in 4 states/UT are given in the bar diagram. Study the diagram and answer the question.
In which State\UT is there the smallest number of owners of the BSNL Sim-card?SSC CGL 2022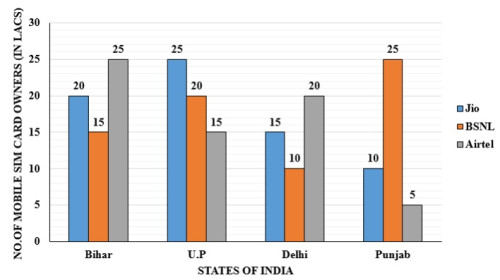
Bihar
337)The bar graph given below shows the percentage distribution of the total production of six different types of cars by a car manufacturing company over 2 years.
If 75% of the T type cars produced in each year were sold by the company, how many T type cars remain unsold?SSC CGL 2022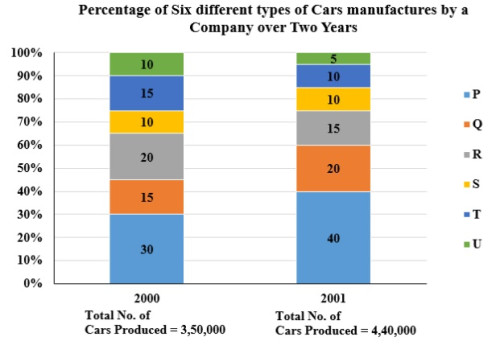
24125
SSC CGL 2022338)The table given below shows the number of working days of a company in 5 years.
What are ratio of number of working days in year R to the number of working days in year T?
Years
Working days
P
110
Q
310
R
160
S
60
T
210
16 : 21
SSC CGL 2022339)The table given below shows the number of salesman in five companies.
Number of salesman in J is what percent of the number of salesman in K?
Companies
Salesman
J
45
K
20
L
40
M
15
N
25
225 percent
340)Study the given graph and answer the following question.
The number of lecturers recruited in state B in the year 2019 was what percentage of the number of lecturers recruited in state C in the year 2021? (Correct to 2 decimal places.)SSC CGL 2022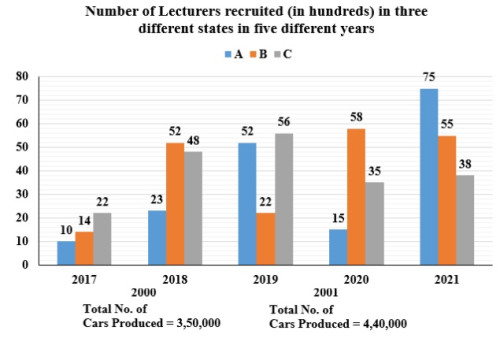
57.89 %