objective Ques (356 results)
SSC CGL 2022301)Study the histogram and answer the question given below.
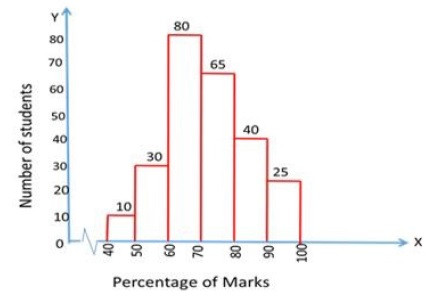
The graph represents the number of students obtaining a percentage of marks in class X Board examination in 2018 in a school.
The number of students who have secured less than 60% marks is what per cent less than the number of students who have secured 80% marks and above?
38.5%
302)The following pie charts show the number of students studying in different departments of an institute during the academic years 2019 and 2020. The total number of students was 2000 and 2400, respectively, in the academic years 2019 and 2020.
What are the ratio of Commerce and Computer Science students taken together in 2019 to Engineering and Medical students taken together in 2020?SSC CGL 2022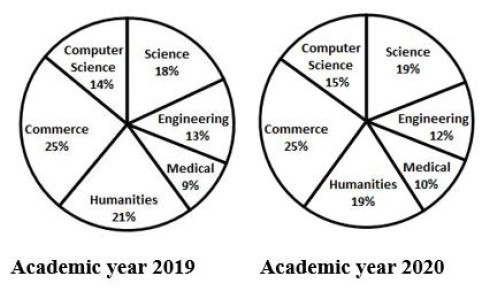
65 ∶ 44
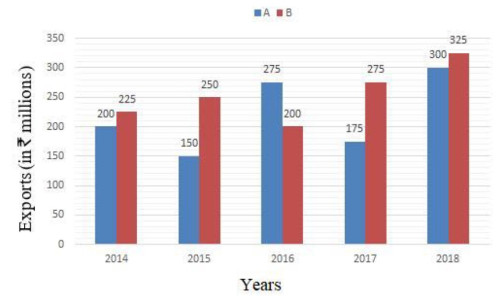
SSC CGL 2022303)The following bar graph shows exports of cars of type A and B (in ₹ millions) from 2014 to 2018. Study the graph and answer the question that follows.
Exports of Cars of Type A and B (in ₹ millions) during 2014 to 2018.
The total exports of cars of type A in 2014 to 2018 is what per cent more than the total exports of cars of type B in 2015 to 2017? (Correct to one decimal place)
51.7%
304)Monthly expenditure of a family on different heads is shown in the following pie chart. The family earns ₹1,08,000 every month.
What is the amount spent on Rent every month (in ₹)?SSC CGL 2022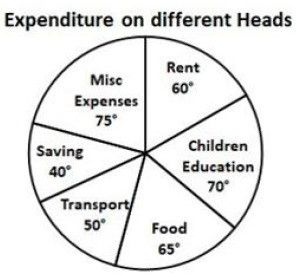
18,000
SSC CGL 2022305)The breakup of the total number of employees of a company working in different offices (A to E), in degrees, is given in the pie chart. The total number of employees = 2400.
If the percentage of male employees in office C is 20% and that of female employees in E is 40%, then what is the ratio of the numbers of female employees in E to that of female employees in C?
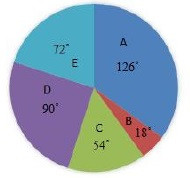
2 ∶ 3
SSC CGL 2022306)The given pie chart shows the percentage of students in five schools and the table shows the ratio of boys and girls in each school.
Study the pie chart and table and answer the question that follows.
The below table shows the ratio of girls and boys in the given five schools.
The number of girls in school D is what percentage less than the number of boys in school B (correct to the nearest integer)?
School Girls ∶ Boys A 3 ∶ 4 B 2 ∶ 3 C 5 ∶ 3 D 1 ∶ 2 E 4 ∶ 1
33%
307)The following bar graph shows the total number of youth (in lakhs) and the number of employed youth (in lakhs) in 5 states A, B, C, D and E.
How many youth (in lakhs) are unemployed in states B and D taken together?SSC CGL 2022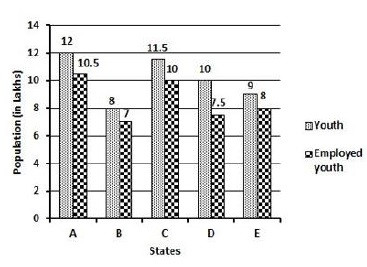
3.5
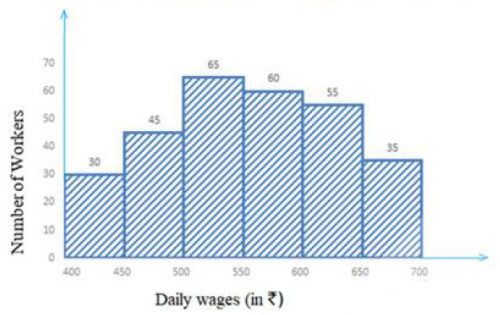
SSC CGL 2022308)Study the graph and answer the question that follows.
What is the ratio of the total number of workers whose daily wages are less than ₹450 to the total number of workers whose daily wages are ₹650 and above?
 from 2014 to 2018. Study the graph and answer the question that follows.<br> Exports of Cars of Type A and B (in ₹ millions) during 2014 to 2018.<br><img class="img-fluid pr-2 py-1 qImg extra-img" src="https://scorekhel.com/storage/practiceQuestion/Que12319/eng/extra-image.jpg" /><br> The total exports of cars of type A in 2014 to 2018 is what per cent more than the total exports of cars of type B in 2015 to 2017? (Correct to one decimal place))
 from 2014 to 2018. Study the graph and answer the question that follows.<br> Exports of Cars of Type A and B (in ₹ millions) during 2014 to 2018.<br><img class=\"img-fluid pr-2 py-1 qImg extra-img\" src=\"https://scorekhel.com/storage/practiceQuestion/Que12319/eng/extra-image.jpg\" /><br> The total exports of cars of type A in 2014 to 2018 is what per cent more than the total exports of cars of type B in 2015 to 2017? (Correct to one decimal place)**%0D%0AA%29 50.4%%0D%0AB%29 51.7%%0D%0AC%29 41.3%%0D%0AD%29 44.3% %0D%0AClick Link for Answer)
, in degrees, is given in the pie chart. The total number of employees = 2400.<br><img class="img-fluid pr-2 py-1 qImg extra-img" src="https://scorekhel.com/storage/practiceQuestion/Que12405/eng/extra-image.jpg" /><br> If the percentage of male employees in office C is 20% and that of female employees in E is 40%, then what is the ratio of the numbers of female employees in E to that of female employees in C?)
, in degrees, is given in the pie chart. The total number of employees = 2400.<br><img class=\"img-fluid pr-2 py-1 qImg extra-img\" src=\"https://scorekhel.com/storage/practiceQuestion/Que12405/eng/extra-image.jpg\" /><br> If the percentage of male employees in office C is 20% and that of female employees in E is 40%, then what is the ratio of the numbers of female employees in E to that of female employees in C?**%0D%0AA%29 3 ∶ 2%0D%0AB%29 3 ∶ 8%0D%0AC%29 5 ∶ 4%0D%0AD%29 2 ∶ 3 %0D%0AClick Link for Answer)
?<br> <div class="mce-resize-bar mce-resize-bar-row" data-mce-bogus="all" data-mce-resize="false" data-mce-style="cursor: row-resize; margin: 0; padding: 0; position: absolute; left: 10px; top: 134.5px; height: 4px; width: 174px; " data-row="0" style=" margin: 0px; padding: 0px; position: absolute; left: 10px; top: 134.5px; height: 4px; width: 174px;" unselectable="on"> </div> <div class="mce-resize-bar mce-resize-bar-row" data-mce-bogus="all" data-mce-resize="false" data-mce-style="cursor: row-resize; margin: 0; padding: 0; position: absolute; left: 10px; top: 155.5px; height: 4px; width: 174px; " data-row="1" style=" margin: 0px; padding: 0px; position: absolute; left: 10px; top: 155.5px; height: 4px; width: 174px;" unselectable="on"> </div> <div class="mce-resize-bar mce-resize-bar-row" data-mce-bogus="all" data-mce-resize="false" data-mce-style="cursor: row-resize; margin: 0; padding: 0; position: absolute; left: 10px; top: 176.5px; height: 4px; width: 174px; " data-row="2" style=" margin: 0px; padding: 0px; position: absolute; left: 10px; top: 176.5px; height: 4px; width: 174px;" unselectable="on"> </div> <div class="mce-resize-bar mce-resize-bar-row" data-mce-bogus="all" data-mce-resize="false" data-mce-style="cursor: row-resize; margin: 0; padding: 0; position: absolute; left: 10px; top: 197.5px; height: 4px; width: 174px; " data-row="3" style=" margin: 0px; padding: 0px; position: absolute; left: 10px; top: 197.5px; height: 4px; width: 174px;" unselectable="on"> </div> <div class="mce-resize-bar mce-resize-bar-row" data-mce-bogus="all" data-mce-resize="false" data-mce-style="cursor: row-resize; margin: 0; padding: 0; position: absolute; left: 10px; top: 218.5px; height: 4px; width: 174px; " data-row="4" style=" margin: 0px; padding: 0px; position: absolute; left: 10px; top: 218.5px; height: 4px; width: 174px;" unselectable="on"> </div> <div class="mce-resize-bar mce-resize-bar-row" data-mce-bogus="all" data-mce-resize="false" data-mce-style="cursor: row-resize; margin: 0; padding: 0; position: absolute; left: 10px; top: 239.5px; height: 4px; width: 174px; " data-row="5" style=" margin: 0px; padding: 0px; position: absolute; left: 10px; top: 239.5px; height: 4px; width: 174px;" unselectable="on"> </div> <div class="mce-resize-bar mce-resize-bar-col" data-col="0" data-mce-bogus="all" data-mce-resize="false" data-mce-style="cursor: col-resize; margin: 0; padding: 0; position: absolute; left: 72.984375px; top: 115px; height: 127px; width: 4px; " style=" margin: 0px; padding: 0px; position: absolute; left: 72.9844px; top: 115px; height: 127px; width: 4px;" unselectable="on"> </div>)
?<br> <div class=\"mce-resize-bar mce-resize-bar-row\" data-mce-bogus=\"all\" data-mce-resize=\"false\" data-mce-style=\"cursor: row-resize; margin: 0; padding: 0; position: absolute; left: 10px; top: 134.5px; height: 4px; width: 174px; \" data-row=\"0\" style=\" margin: 0px; padding: 0px; position: absolute; left: 10px; top: 134.5px; height: 4px; width: 174px;\" unselectable=\"on\"> </div> <div class=\"mce-resize-bar mce-resize-bar-row\" data-mce-bogus=\"all\" data-mce-resize=\"false\" data-mce-style=\"cursor: row-resize; margin: 0; padding: 0; position: absolute; left: 10px; top: 155.5px; height: 4px; width: 174px; \" data-row=\"1\" style=\" margin: 0px; padding: 0px; position: absolute; left: 10px; top: 155.5px; height: 4px; width: 174px;\" unselectable=\"on\"> </div> <div class=\"mce-resize-bar mce-resize-bar-row\" data-mce-bogus=\"all\" data-mce-resize=\"false\" data-mce-style=\"cursor: row-resize; margin: 0; padding: 0; position: absolute; left: 10px; top: 176.5px; height: 4px; width: 174px; \" data-row=\"2\" style=\" margin: 0px; padding: 0px; position: absolute; left: 10px; top: 176.5px; height: 4px; width: 174px;\" unselectable=\"on\"> </div> <div class=\"mce-resize-bar mce-resize-bar-row\" data-mce-bogus=\"all\" data-mce-resize=\"false\" data-mce-style=\"cursor: row-resize; margin: 0; padding: 0; position: absolute; left: 10px; top: 197.5px; height: 4px; width: 174px; \" data-row=\"3\" style=\" margin: 0px; padding: 0px; position: absolute; left: 10px; top: 197.5px; height: 4px; width: 174px;\" unselectable=\"on\"> </div> <div class=\"mce-resize-bar mce-resize-bar-row\" data-mce-bogus=\"all\" data-mce-resize=\"false\" data-mce-style=\"cursor: row-resize; margin: 0; padding: 0; position: absolute; left: 10px; top: 218.5px; height: 4px; width: 174px; \" data-row=\"4\" style=\" margin: 0px; padding: 0px; position: absolute; left: 10px; top: 218.5px; height: 4px; width: 174px;\" unselectable=\"on\"> </div> <div class=\"mce-resize-bar mce-resize-bar-row\" data-mce-bogus=\"all\" data-mce-resize=\"false\" data-mce-style=\"cursor: row-resize; margin: 0; padding: 0; position: absolute; left: 10px; top: 239.5px; height: 4px; width: 174px; \" data-row=\"5\" style=\" margin: 0px; padding: 0px; position: absolute; left: 10px; top: 239.5px; height: 4px; width: 174px;\" unselectable=\"on\"> </div> <div class=\"mce-resize-bar mce-resize-bar-col\" data-col=\"0\" data-mce-bogus=\"all\" data-mce-resize=\"false\" data-mce-style=\"cursor: col-resize; margin: 0; padding: 0; position: absolute; left: 72.984375px; top: 115px; height: 127px; width: 4px; \" style=\" margin: 0px; padding: 0px; position: absolute; left: 72.9844px; top: 115px; height: 127px; width: 4px;\" unselectable=\"on\"> </div>**%0D%0AA%29 35%%0D%0AB%29 33%%0D%0AC%29 19%%0D%0AD%29 27% %0D%0AClick Link for Answer)
6 ∶ 7
SSC CGL 2022309)The following table shows the number of pages printed by 3 printers during 3 days.
What is the average number of pages printed by printer Z during the 3 days?
Printers/Days X Y Z Monday 130 140 210 Tuesday 110 145 160 Wednesday 180 90 218
196
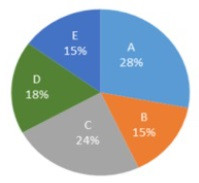
310)The pie chart given below shows the number of truck sold by 8 different companies. The total number of truck sold by all these 8 companies are 4000. Number of truck sold by a particular company is shown as a percent of total number of truck sold by all these 8 companies.
The number of trucks sold by B, C, F and H is how much percent less than the number of trucks sold by all these 8 companies?SSC CGL 2022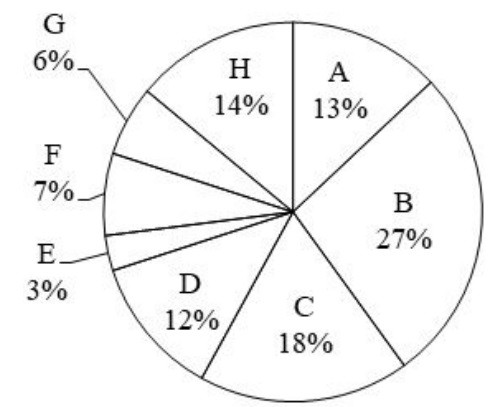
34 percent