objective Ques (356 results)
SSC CGL 2022261)The given bar chat represents the Televisions Sets (TV) manufactured (in thousands) and the respective percentage of those TV Sets sold by five different companies A, B, C, D and E in 2015.
Study the chart carefully and answer the question that follows.
What is the ratio of the number of TV sets sold by company A to that of company B in 2015?
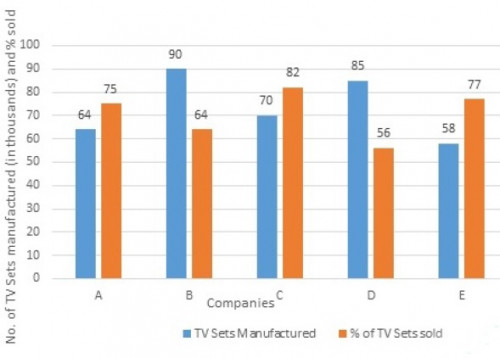
5 : 6
SSC CGL 2022262)Study the given histogram and answer the question that follows.
What is the difference between the total number of workers whose daily wages are less than ₹450 and the total number of workers whose daily wages are ₹650 and above?
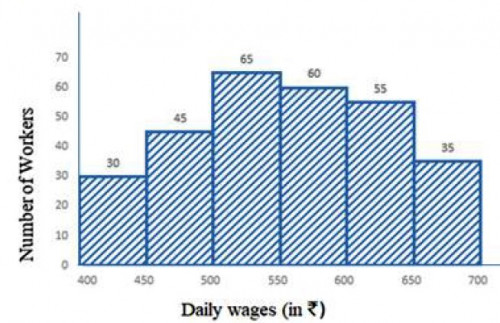
5
SSC CGL 2022263)The following bar chart shows the number of students enrolled in two Summer Camps A and B from 2014 to 2019. Study the chart carefully and answer the question that follows.
What is the ratio of the students enrolled in Camp A in 2014, 2016 and 2017 to the students enrolled in Camp B in 2015, 2018 and 2019?
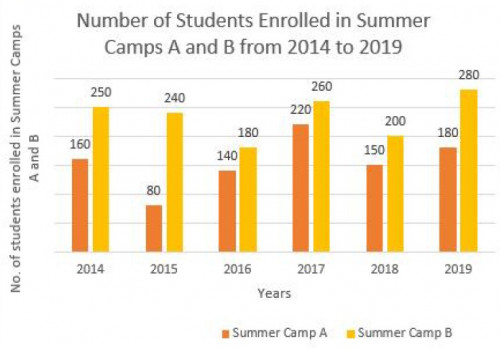
13 : 18
SSC CGL 2022264)The given pie chart shows the percentage of students in five schools and the table shows the ratio of boys and girls in each school.
Study the pie chart and table and answer the question that follows.
The below table shows the ratio of girls and boys in the given five schools.
What is the ratio of the number of boys in school C to the number of girls in school E?
School Girls : Boys A 3 ∶ 4 B 2 : 3 C 5 : 3 D 1 : 2 E 4 : 1
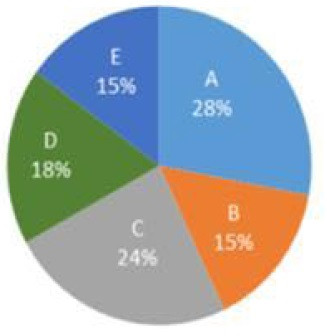
3 : 4
SSC CGL 2022265)The given bar graph shows exports of cars of type A and B( in ₹millions) from 2014 to 2018. Study the graph and answer the question that follows.
Exports of Cars of Type A and B (in ₹millions) during 2014 to 2018.
In which year are the exports of cars A ₹20 million more that the average exports( per year) of cars of type B?
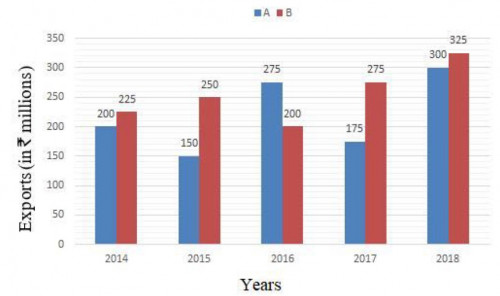
2016
266)The number of cars passing the road near a colony from 6 am to 12 noon has been shown in the following histogram.
During which hour(s) is the number of cars passed more than the average number of cars passed from 6 am to 11 am?SSC CGL 2022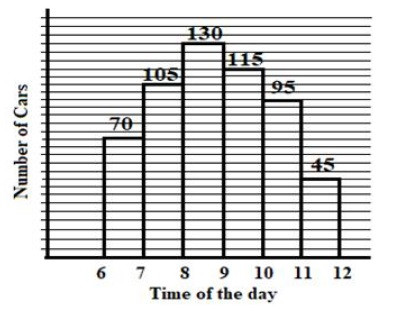
7-8 am, 8-9 am, 9-10 am
SSC CGL 2022267)The following pie chart shows the distribution of percentage of a certain corporate office employees in various age-groups.
Total number of employees of the corporate office = 2500
Study the chart carefully and answer the question that follows.
What is the central angle (in degrees) corresponding to the age groups 38+ to 48 years and 58+ years and above ,taken together?
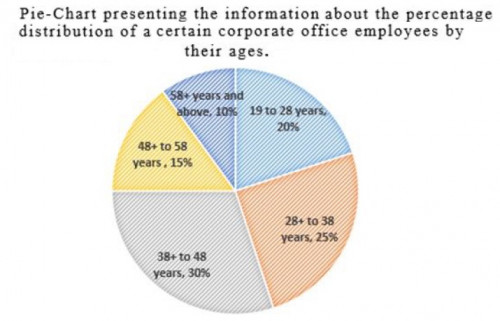
144
SSC CGL 2022268)The given bar graph shows the sales of computer from six dealer A, B, C, D, E and F, during two consecutive years 2015 and 2016. Study the graph and answer the question that follows.
What is the ratio of the total sales from dealers A, B and C taken together for the year 2015 to the sales from dealers D, E and F taken together for the year 2016 ?
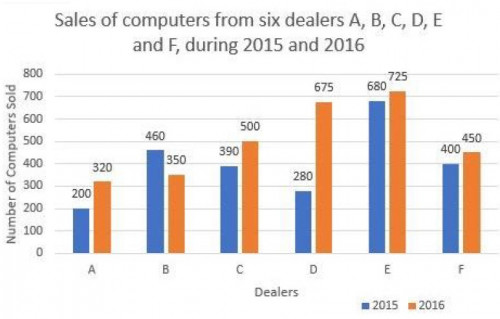
21 : 37
SSC CGL 2022269)Study the given histogram and answer the question that follows.
The total number of workers whose daily wages are less than Rs.500 is what percentage more than the total number of workers whose daily wages are Rs.650 and above (correct to one decimal place)?
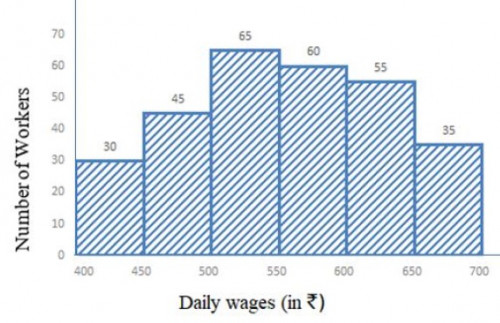
114.3%
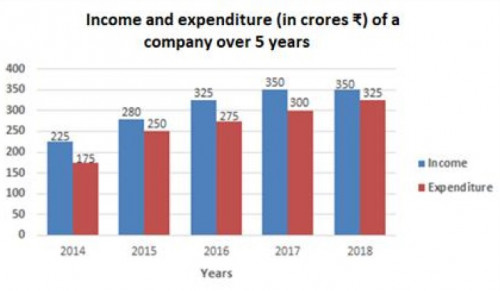
SSC CGL 2022270)The given bar graph shows the income and expenditure (in crores Rs.) of a company over 5 years, from 2014 to 2018. Study the bar graph and answer the question that follows.
In which of the following years is the ratio of income to expenditure the minimum?
 manufactured (in thousands) and the respective percentage of those TV Sets sold by five different companies A, B, C, D and E in 2015.<br> Study the chart carefully and answer the question that follows.<br><img class="img-fluid pr-2 py-1 qImg extra-img" src="https://scorekhel.com/storage/practiceQuestion/Que11417/eng/extra-image.jpg" /><br> What is the ratio of the number of TV sets sold by company A to that of company B in 2015?)
 manufactured (in thousands) and the respective percentage of those TV Sets sold by five different companies A, B, C, D and E in 2015.<br> Study the chart carefully and answer the question that follows.<br><img class=\"img-fluid pr-2 py-1 qImg extra-img\" src=\"https://scorekhel.com/storage/practiceQuestion/Que11417/eng/extra-image.jpg\" /><br> What is the ratio of the number of TV sets sold by company A to that of company B in 2015?**%0D%0AA%29 4 : 5%0D%0AB%29 5 : 4%0D%0AC%29 5 : 6%0D%0AD%29 6 : 5 %0D%0AClick Link for Answer)
 from 2014 to 2018. Study the graph and answer the question that follows.<br> Exports of Cars of Type A and B (in ₹millions) during 2014 to 2018.<br><img class="img-fluid pr-2 py-1 qImg extra-img" src="https://scorekhel.com/storage/practiceQuestion/Que11445/eng/extra-image.jpg" /><br> In which year are the exports of cars A ₹20 million more that the average exports( per year) of cars of type B?)
 from 2014 to 2018. Study the graph and answer the question that follows.<br> Exports of Cars of Type A and B (in ₹millions) during 2014 to 2018.<br><img class=\"img-fluid pr-2 py-1 qImg extra-img\" src=\"https://scorekhel.com/storage/practiceQuestion/Que11445/eng/extra-image.jpg\" /><br> In which year are the exports of cars A ₹20 million more that the average exports( per year) of cars of type B?**%0D%0AA%29 2016%0D%0AB%29 2014%0D%0AC%29 2015%0D%0AD%29 2017 %0D%0AClick Link for Answer)
 corresponding to the age groups 38+ to 48 years and 58+ years and above ,taken together?)
 corresponding to the age groups 38+ to 48 years and 58+ years and above ,taken together?**%0D%0AA%29 120%0D%0AB%29 144%0D%0AC%29 36%0D%0AD%29 108 %0D%0AClick Link for Answer)
?)
?**%0D%0AA%29 101.2%%0D%0AB%29 110.5%%0D%0AC%29 111.8%%0D%0AD%29 114.3% %0D%0AClick Link for Answer)
 of a company over 5 years, from 2014 to 2018. Study the bar graph and answer the question that follows.<br><img class="img-fluid pr-2 py-1 qImg extra-img" src="https://scorekhel.com/storage/practiceQuestion/Que11481/eng/extra-image.jpg" /><br> In which of the following years is the ratio of income to expenditure the minimum?)
 of a company over 5 years, from 2014 to 2018. Study the bar graph and answer the question that follows.<br><img class=\"img-fluid pr-2 py-1 qImg extra-img\" src=\"https://scorekhel.com/storage/practiceQuestion/Que11481/eng/extra-image.jpg\" /><br> In which of the following years is the ratio of income to expenditure the minimum?**%0D%0AA%29 2014%0D%0AB%29 2018%0D%0AC%29 2017%0D%0AD%29 2016 %0D%0AClick Link for Answer)
2018