objective Ques (356 results)
241)The following bar graph shows the number of youth (in lakhs) and the number of employed youth (in lakhs) in 5 states A, B, C, D and E.
In which state(s) is the number of youth more than the average number of youth in the five states?SSC CGL 2022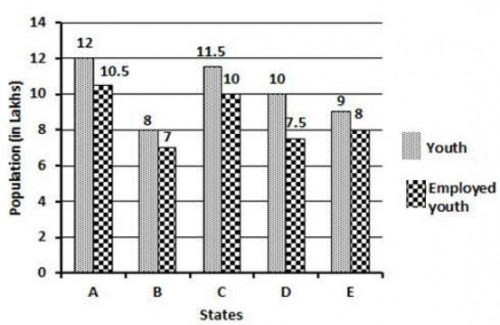
A, C
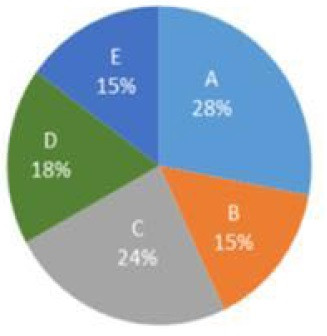
SSC CGL 2022242)The breakup of the total number of employees of a company working in different offices (A to E), in degrees, is given in the pie chart.
Total number of employees = 2400.
In which office is the number of employees 600?
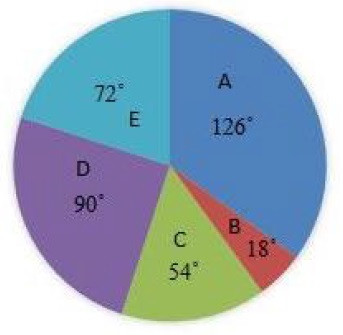
D
SSC CGL 2022243)The following bar chart shows the number of students enrolled in two summer Camps A and B from 2014 to 2019. Study the chart carefully and answer the question that follows.
The number of students enrolled in Camp A in 2016 and 2019 together is what percentage of the number of students enrolled in Camp B in 2015 and 2017 together?
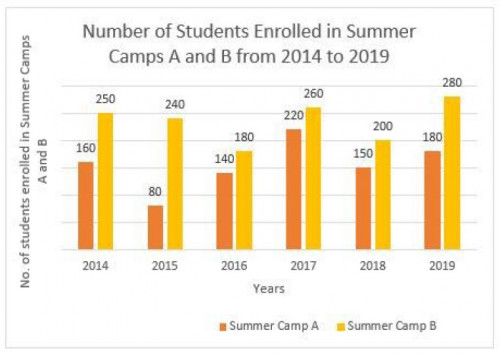
64%
SSC CGL 2022244)The given histogram represents the marks of students in Mathematics test of a certain class. The total number of students is 350 and the maximum marks of the test are 200.
Study the graph and answer the question that follows.
What is the class average (correct up to one place of decimal) of mathematics test?
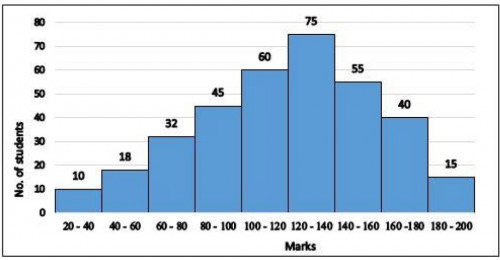
119.3
245)The following histogram shows the marks scored by 40 students in a test of 30 marks. A student has to score a minimum of 10 marks to pass the test.
What is the percentage of students who scored 20 or more marks? (correct to one decimal place)SSC CGL 2022
37.5%
SSC CGL 2022246)The given pie chart shows the percentage of students in five schools and the table shows the ratio of boys and girls in each school.
Study the pie chart and table and answer the question that follows
The below table shows the ratio of girls and boys in the given five schools.
School
Girls : Boys
A
3 ∶ 4
B
2 ∶ 3
C
5 ∶ 3
D
1 ∶ 2
E
4 ∶ 1
If the total number of girls from all five schools is represented as a pie chart, then what will be the measure of the sector angle (to the nearest integer) corresponding to school B?
42°
247)The following bar graph shows receipts and expenditure of a business firm over 5 years. Gain = Receipts - Expenditure.
What is the increase percentage in receipts from 2017 to 2018?SSC CGL 2022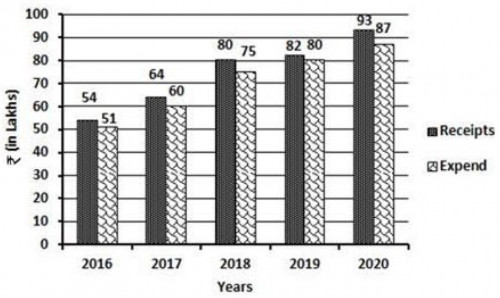
25
248)The following bar graph shows the number of youth (in lakhs) and the number of employed youth (in lakhs) in five states A, B, C, D and E.
Which state(s) has employed youth less than 80% of its total youth population?SSC CGL 2022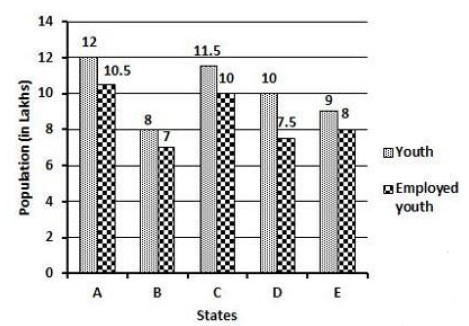
D
SSC CGL 2022249)The following histogram shows the marks scored by 40 student in a test of 30 marks. A student has to score a minimum of 10 marks to pass the test.
How many students have passed the test and obtained less than 50% marks?
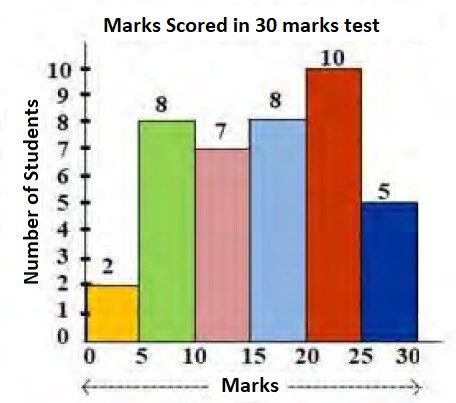
7
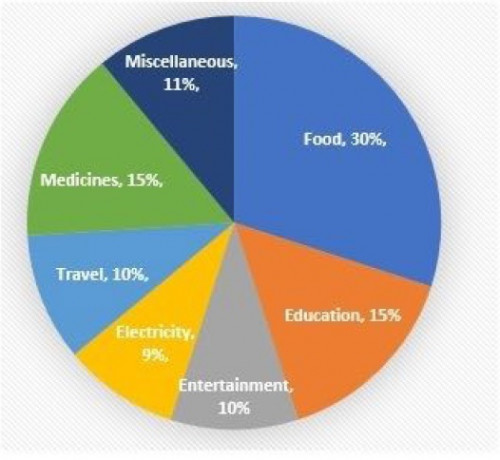
250)The given pie chart show the monthly household expenditure of Family A and Family B under various heads. The monthly expenditures incurred for Family A and Family B are ₹50,000 and ₹75,000, respectively.
Study the charts carefully and answer the question: If the monthly expenditures of both families are combined together then the expenditures on Entertainment of both families together will be what percentage of the total monthly expenditures of both families? Express your answer to the nearest integer.
Monthly Household Expenditure of ₹50,000 under various heads of Family A
Monthly household expenditure of ₹75,000 under various heads for Family BSSC CGL 2022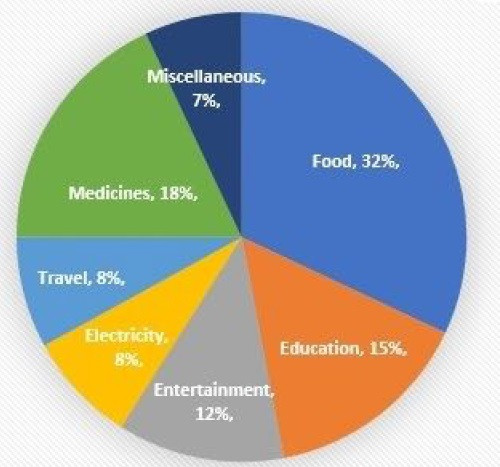
, in degrees, is given in the pie chart.<br> Total number of employees = 2400.<br><img class="img-fluid pr-2 py-1 qImg extra-img" src="https://scorekhel.com/storage/practiceQuestion/Que10435/eng/extra-image.jpg" /><br> In which office is the number of employees 600?)
, in degrees, is given in the pie chart.<br> Total number of employees = 2400.<br><img class=\"img-fluid pr-2 py-1 qImg extra-img\" src=\"https://scorekhel.com/storage/practiceQuestion/Que10435/eng/extra-image.jpg\" /><br> In which office is the number of employees 600?**%0D%0AA%29 C%0D%0AB%29 A%0D%0AC%29 E%0D%0AD%29 D %0D%0AClick Link for Answer)
 of mathematics test?)
 of mathematics test?**%0D%0AA%29 115.8%0D%0AB%29 123.7%0D%0AC%29 119.3%0D%0AD%29 127.3 %0D%0AClick Link for Answer)
 corresponding to school B?)
 corresponding to school B?**%0D%0AA%29 58°%0D%0AB%29 32°%0D%0AC%29 48°%0D%0AD%29 42° %0D%0AClick Link for Answer)
11%