objective Ques (356 results)
231)Monthly expenditure of a family on different heads is shown in the following pie chart. The family earns Rs. 1,08,000 every month.
The money (in Rs.) spent on Misc. Expenses is how much more than that spent on Children Education?SSC CGL 2022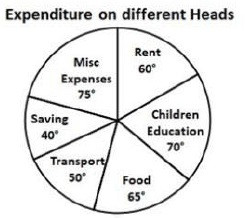
1,500
SSC CGL 2022232)The given histogram shows the daily wages ( in Rs.) of workers in a factory.
study the histogram and answer the question that follows.
The number of workers with daily wages less than Rs. 180 is what percentage of the number of workers with daily wages more than Rs. 190? Express your answer correct to one decimal place.
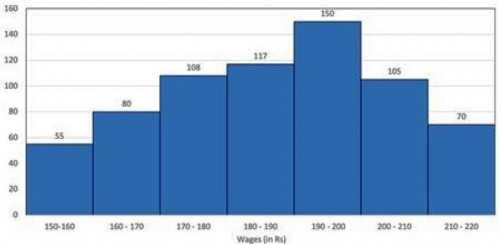
74.8%
SSC CGL 2022233)Performance of 1800 students in grades has been shown in the following pie chart.
In which two grades taken together is the number of students 54 less than the number of students in grades B and E taken together?
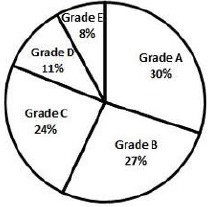
C and E
SSC CGL 2022234)The following pie-charts show the number of students studying in different departments of an institute during the academic years 2019 and 2020. The total number of students was 2000 and 2400 in academic years 2019 and 2020, respectively.
What is the percentage increase or decrease in the number of students of Engineering in 2020 as compared to 2019? (correct to 2 decimal places)
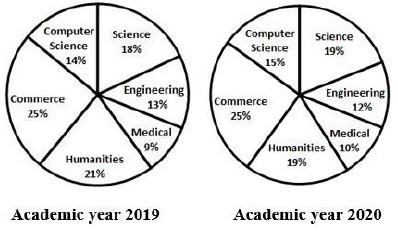
10.77%
SSC CGL 2022235)The following bar graph shows the total number of youth (in lakhs) and the number of employed youth (in lakhs) in 5 states A, B, C, D and E.
Which state has the maximum number of unemployed youth?
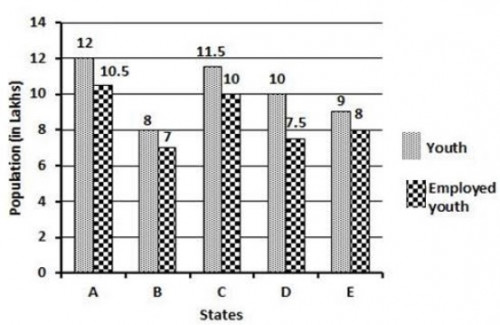
D
SSC CGL 2022236)Study the given histogram that shows the height (in cm) of 100 students in an athletic team and answer the question that follows.
Express the number of students with height less than 170 cm as the percentage (correct to one decimal place) of the number of students with height more than 160 cm.
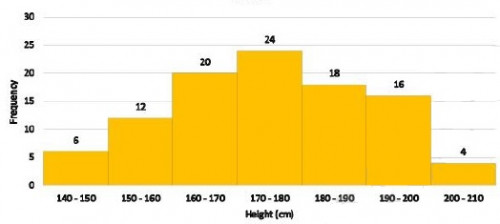
46.3%
237)The following bar graph shows the total number of youth (in lakhs) and the number of employed youth (in lakhs) in states A, B, C, D and E.
What is the ratio of the number of youth in states A, C and E taken together to the number of employed youth in states B, C and D taken together?SSC CGL 2022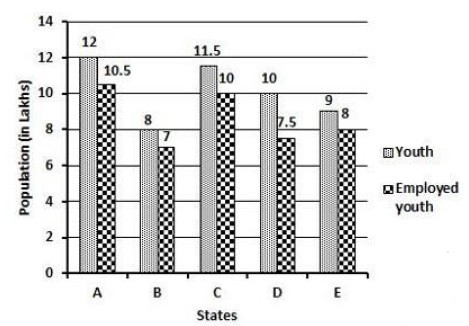
65 ∶ 49
238)Monthly expenditure of a family on different heads is shown in the following pie chart.
What is the percentage of family earnings spent on rent?SSC CGL 2022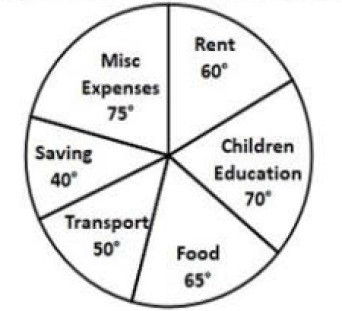
\(16\frac{2}{3}\)
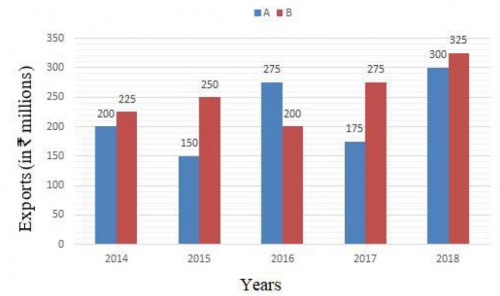
SSC CGL 2022239)The given bar graph shows exports of cars of type A and B (in Rs millions) from 2014 to 2018. Study the graph and answer the question that follows.
What is the ratio of the total exports of cars of type A in 2014 and 2018 to the total exports of cars of type B in 2015 and 2017?
 of workers in a factory.<br> study the histogram and answer the question that follows.<br><img class="img-fluid pr-2 py-1 qImg extra-img" src="https://scorekhel.com/storage/practiceQuestion/Que10166/eng/extra-image.jpg" /><br> The number of workers with daily wages less than Rs. 180 is what percentage of the number of workers with daily wages more than Rs. 190? Express your answer correct to one decimal place.)
 of workers in a factory.<br> study the histogram and answer the question that follows.<br><img class=\"img-fluid pr-2 py-1 qImg extra-img\" src=\"https://scorekhel.com/storage/practiceQuestion/Que10166/eng/extra-image.jpg\" /><br> The number of workers with daily wages less than Rs. 180 is what percentage of the number of workers with daily wages more than Rs. 190? Express your answer correct to one decimal place.**%0D%0AA%29 74.8%%0D%0AB%29 85.6%%0D%0AC%29 75.8%%0D%0AD%29 86.7% %0D%0AClick Link for Answer)
)
**%0D%0AA%29 11.77%%0D%0AB%29 10.77%%0D%0AC%29 10.25%%0D%0AD%29 10.55% %0D%0AClick Link for Answer)
 and the number of employed youth (in lakhs) in 5 states A, B, C, D and E.<br><img class="img-fluid pr-2 py-1 qImg extra-img" src="https://scorekhel.com/storage/practiceQuestion/Que10240/eng/extra-image.jpg" /><br> Which state has the maximum number of unemployed youth?)
 and the number of employed youth (in lakhs) in 5 states A, B, C, D and E.<br><img class=\"img-fluid pr-2 py-1 qImg extra-img\" src=\"https://scorekhel.com/storage/practiceQuestion/Que10240/eng/extra-image.jpg\" /><br> Which state has the maximum number of unemployed youth?**%0D%0AA%29 D%0D%0AB%29 B%0D%0AC%29 E%0D%0AD%29 A %0D%0AClick Link for Answer)
 of 100 students in an athletic team and answer the question that follows.<br><img class="img-fluid pr-2 py-1 qImg extra-img" src="https://scorekhel.com/storage/practiceQuestion/Que10247/eng/extra-image.jpg" /><br> Express the number of students with height less than 170 cm as the percentage (correct to one decimal place) of the number of students with height more than 160 cm.)
 of 100 students in an athletic team and answer the question that follows.<br><img class=\"img-fluid pr-2 py-1 qImg extra-img\" src=\"https://scorekhel.com/storage/practiceQuestion/Que10247/eng/extra-image.jpg\" /><br> Express the number of students with height less than 170 cm as the percentage (correct to one decimal place) of the number of students with height more than 160 cm.**%0D%0AA%29 46.3%%0D%0AB%29 53.7%%0D%0AC%29 73.5%%0D%0AD%29 29.1% %0D%0AClick Link for Answer)
 from 2014 to 2018. Study the graph and answer the question that follows.<br><img class="img-fluid pr-2 py-1 qImg extra-img" src="https://scorekhel.com/storage/practiceQuestion/Que10342/eng/extra-image.jpg" /><br> What is the ratio of the total exports of cars of type A in 2014 and 2018 to the total exports of cars of type B in 2015 and 2017?)
 from 2014 to 2018. Study the graph and answer the question that follows.<br><img class=\"img-fluid pr-2 py-1 qImg extra-img\" src=\"https://scorekhel.com/storage/practiceQuestion/Que10342/eng/extra-image.jpg\" /><br> What is the ratio of the total exports of cars of type A in 2014 and 2018 to the total exports of cars of type B in 2015 and 2017?**%0D%0AA%29 10 ∶ 9%0D%0AB%29 20 ∶ 21%0D%0AC%29 5 ∶ 4%0D%0AD%29 13 ∶ 12 %0D%0AClick Link for Answer)
20 ∶ 21
240)The following histogram shows the marks scored by 40 students in a test of 30 marks. A student has to score a minimum of 10 marks to pass the test.
How many students have scored less than two-third of the total marks?SSC CGL 2022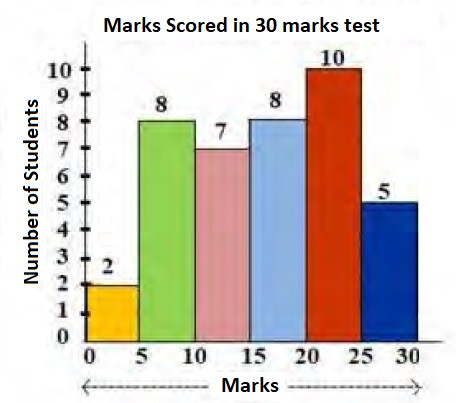
25