objective Ques (356 results)
SSC CPO 2020211)The given pie charts represent the popularity of ice-cream flavours in the years 2005 and 2015.
If a percentage point shift results in annual additional sales of Rs. 5,000. how much (in Rs.) did the combined annual strawberry and butterscotch sales increase from 2005 to 2015 ?
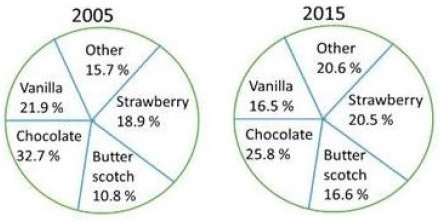
37,000
SSC CPO 2020212)The given graph shows the number of students of two schools over a period of six years.
In the bar graph, in which year is the absolute difference of the students from schools A to B taken together is maximum ?
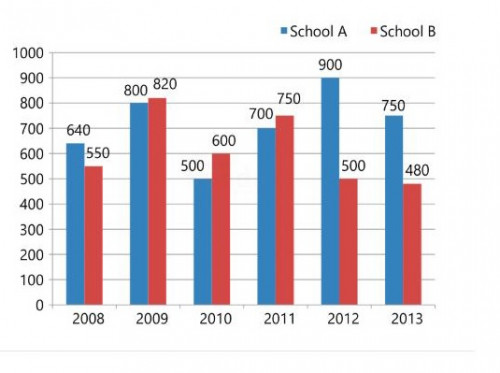
2012
SSC CPO 2020213)The given bar graph shows the number of student of two schools over a period of six years.
In the bar graph, what is the ratio of the average of total students from school B to the average of total student from school A ?
370 : 429
SSC CPO 2020214)The following histogram shows the weights of students of class X in a school on a particular day. Total number of students enrolled in class X = 200
The number of students weighing less than 55 kg is what percentage less than the number of students weighing 55 kg to 65 kg ?
5%
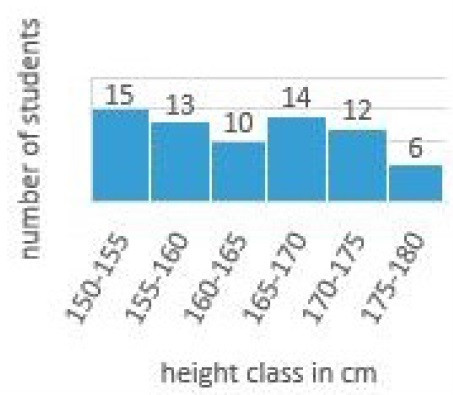
SSC CPO 2020215)The given histogram shows the height of the students.
What is the percentage of student whose height is in the class interval 165-175 ?
37
SSC CPO 2020216)Study the given histogram that shows the marks obtained by students in an examination and answer the question that follows.
If the total marks obtained by students be represented as a pie chart, then the central angle of the sector representing marks 200 or more but less than 300, is: (correct to the nearest degree)
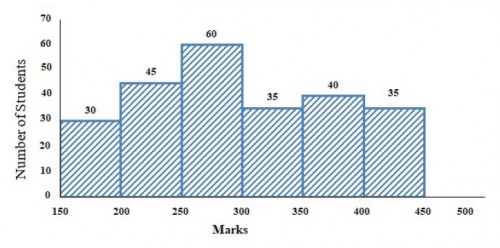
154°
SSC CPO 2020217)The following pie chart shows the percentage expenditure of a country on different heads. The total expenditure is Rs. 1,680 (in billions). Study the chart and answer the question.
The expenditure on Education is what percentage less than the expenditure on Defence?
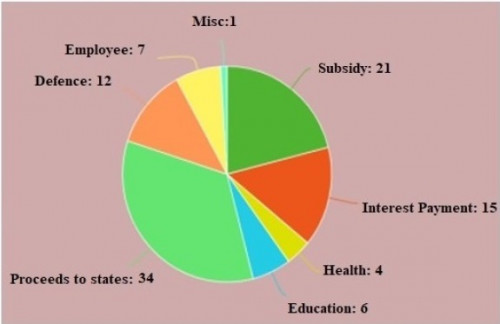
50%
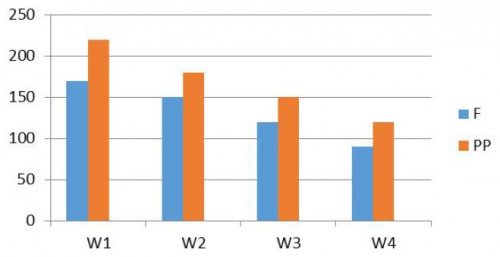
SSC CPO 2020218)The fasting blood sugar level (F) and the post prandial blood sugar level (PP) of a patient was monitored for four weeks W1, W2, W3, W4, and the readings (in mg/dl) for the four weeks are as follows:
F/PP: 170/220, 150/180, 120/150, 90/120.
These have been presented through a bar graph. The normal range is considered to be:
F/PP: 70-100/100-130
During which week was the fasting blood sugar level of the patient approximately 115.4% above the upper limit of normal PP blood sugar level?
 did the combined annual strawberry and butterscotch sales increase from 2005 to 2015 ?)
 did the combined annual strawberry and butterscotch sales increase from 2005 to 2015 ?**%0D%0AA%29 37,000%0D%0AB%29 74,000%0D%0AC%29 65,000%0D%0AD%29 10,000 %0D%0AClick Link for Answer)
)
**%0D%0AA%29 154°%0D%0AB%29 128°%0D%0AC%29 68°%0D%0AD%29 88° %0D%0AClick Link for Answer)
. Study the chart and answer the question.<br><img class="img-fluid pr-2 py-1 qImg extra-img" src="https://scorekhel.com/storage/practiceQuestion/Que9439/eng/extra-image.jpg" /><br> The expenditure on Education is what percentage less than the expenditure on Defence?)
. Study the chart and answer the question.<br><img class=\"img-fluid pr-2 py-1 qImg extra-img\" src=\"https://scorekhel.com/storage/practiceQuestion/Que9439/eng/extra-image.jpg\" /><br> The expenditure on Education is what percentage less than the expenditure on Defence?**%0D%0AA%29 150%%0D%0AB%29 125%%0D%0AC%29 100%%0D%0AD%29 50% %0D%0AClick Link for Answer)
 and the post prandial blood sugar level (PP) of a patient was monitored for four weeks W1, W2, W3, W4, and the readings (in mg/dl) for the four weeks are as follows:<br> F/PP: 170/220, 150/180, 120/150, 90/120.<br> These have been presented through a bar graph. The normal range is considered to be:<br> F/PP: 70-100/100-130<br><img class="img-fluid pr-2 py-1 qImg extra-img" src="https://scorekhel.com/storage/practiceQuestion/Que9449/eng/extra-image.jpg" /><br> During which week was the fasting blood sugar level of the patient approximately 115.4% above the upper limit of normal PP blood sugar level?)
 and the post prandial blood sugar level (PP) of a patient was monitored for four weeks W1, W2, W3, W4, and the readings (in mg/dl) for the four weeks are as follows:<br> F/PP: 170/220, 150/180, 120/150, 90/120.<br> These have been presented through a bar graph. The normal range is considered to be:<br> F/PP: 70-100/100-130<br><img class=\"img-fluid pr-2 py-1 qImg extra-img\" src=\"https://scorekhel.com/storage/practiceQuestion/Que9449/eng/extra-image.jpg\" /><br> During which week was the fasting blood sugar level of the patient approximately 115.4% above the upper limit of normal PP blood sugar level?**%0D%0AA%29 W2%0D%0AB%29 W1%0D%0AC%29 W3%0D%0AD%29 W4 %0D%0AClick Link for Answer)
W2
SSC CPO 2020219)Study the given histogram that shows the marks obtained by students in an examination and answer the question that follows.
The number of students who obtained less than 200 marks is:
30
SSC CPO 2020220)Diagram: Study the chart and answer the question. The following pie chart shows percentage expenditure of a country on different heads.
The expenditure for Proceeds to state (in billions Rs.) is:
 is:)
 is:**%0D%0AA%29 684%0D%0AB%29 571.20%0D%0AC%29 586.50%0D%0AD%29 126 %0D%0AClick Link for Answer)
571.20