objective Ques (356 results)
SSC CPO 2020201)Study the given histogram that shows the marks obtained by students in an examination and answer the question that follows.
The number of students who obtained less than 350 marks is what per cent more than the number of students who obtained 400 or more marks?
(correct to one decimal place)
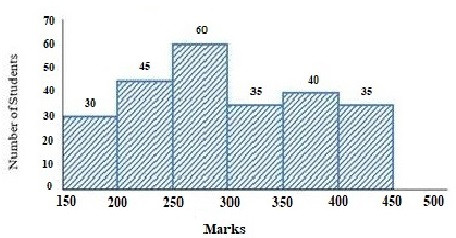
385.7%
SSC CPO 2020202)The given bar graph shows the sales of cars from six branches of a dealer B1, B2, B3, B4, B5, B6, during two consecutive years 2018 and 2019. The 1st bar corresponds to the year 2018 and the 2nd bar corresponds to the year 2019.
In the bar graph, the ratio of the total sales from branches B1, B2 and B3 taken together for the year 2018 to the sales from the branches B6, B4 and B5 for the year 2019, is:
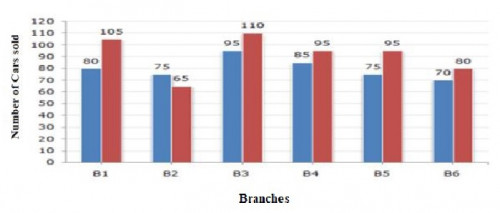
25 : 27
SSC CPO 2020203)The given bar graph shows the sales of cars from six branches of a dealer B1, B2, B3, B4, B5, B6, during two consecutive years 2018 and 2019. Blue color corresponds to the year 2018 and the light blue color corresponds to the year 2019.
The total sale of cars from all the branches in the year 2018 is what percentage less than the total sales of cars from all the branches in the year 2019? (correct to one decimal place)
12.7%
SSC CPO 2020204)Study the given histogram that shows the marks obtained by student in an examination and answer the question that follows.
The number of students who obtained less than 250 marks is:
75
SSC CPO 2020205)The given bar graph shows the sales of cars from six branches of a dealer B1, B2, B3, B4, B5, B6, during two consecutive years 2018 and 2019. Blue colour corresponds to the year 2018 and white shaded line colour corresponds to the year 2019.
The average sales of cars (from all branches) for the year 2018 is:
80
SSC CPO 2020206)In the following pie chart shows percentage of a country on different heads. The total expenditure is Rs. 1,680 (in billions). Study the chart and answer the question.
The central angle of the sector representing expenditure on Subsidy is:
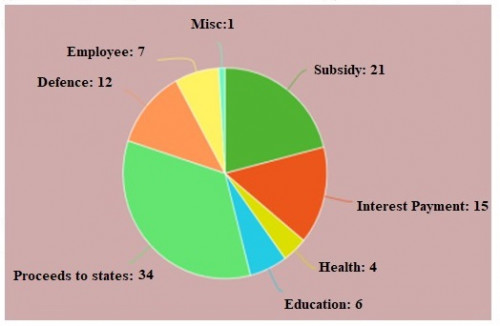
75.6°
SSC CPO 2020207)The given bar graph shows the number of students of two schools over a period of six years.
In the bar graph, what is the ratio of the students taken for years the 2008, 2012, 2013 together from school A to the students taken for the years 2009, 2010, 2011 together from school B ?
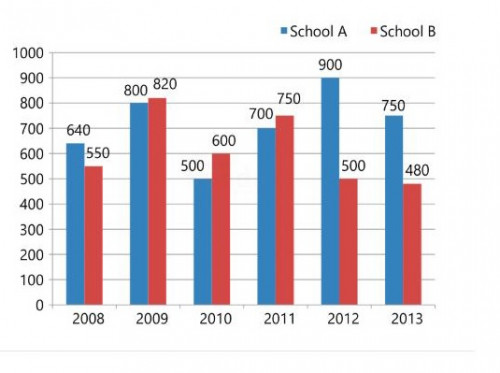
229 : 217
SSC CPO 2020208)The given pie chart represents the popularity of ice-cream flavours in the year 2015.
In 2015, if the total sale of chocolate flavours is for Rs. 5,160, then the total sale (in Rs.) for vanilla flavour is:
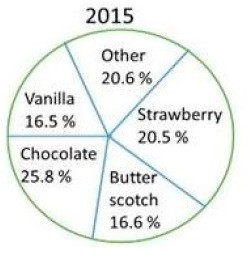
3,300
SSC CPO 2020209)The given pie chart represents the popularity of ice-cream flavours in the year 2005.
In 2005, if 40% of the 'other' category is mix fruit flavour and 1570 people surveyed preferred mix fruit flavour, then how many people were surveyed?
25,000
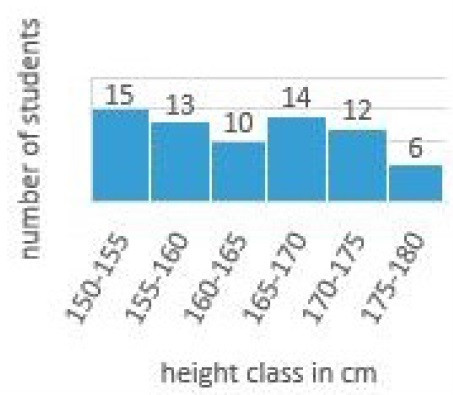
SSC CPO 2020210)The given histogram shows the height of the students.
The number of students whose height is in the class interval 165-170 is what percentage less than the number of students whose height is in the interval 150-155 ? (correct to one decimal place)
)
**%0D%0AA%29 350%%0D%0AB%29 375.8%%0D%0AC%29 385.7%%0D%0AD%29 100% %0D%0AClick Link for Answer)
)
**%0D%0AA%29 14.3%%0D%0AB%29 13.5%%0D%0AC%29 12.7%%0D%0AD%29 11.9% %0D%0AClick Link for Answer)
 for the year 2018 is:)
 for the year 2018 is:**%0D%0AA%29 85%0D%0AB%29 80%0D%0AC%29 90%0D%0AD%29 78 %0D%0AClick Link for Answer)
. Study the chart and answer the question.<br><img class="img-fluid pr-2 py-1 qImg extra-img" src="https://scorekhel.com/storage/practiceQuestion/Que9047/eng/extra-image.jpg" /><br> The central angle of the sector representing expenditure on Subsidy is:)
. Study the chart and answer the question.<br><img class=\"img-fluid pr-2 py-1 qImg extra-img\" src=\"https://scorekhel.com/storage/practiceQuestion/Que9047/eng/extra-image.jpg\" /><br> The central angle of the sector representing expenditure on Subsidy is:**%0D%0AA%29 75.6°%0D%0AB%29 108.3°%0D%0AC%29 90°%0D%0AD%29 54.9° %0D%0AClick Link for Answer)
 for vanilla flavour is:)
 for vanilla flavour is:**%0D%0AA%29 3,300%0D%0AB%29 4,120%0D%0AC%29 4,100%0D%0AD%29 5,160 %0D%0AClick Link for Answer)
)
**%0D%0AA%29 1.9%%0D%0AB%29 4.8%%0D%0AC%29 5.5%%0D%0AD%29 6.7% %0D%0AClick Link for Answer)
6.7%