objective Ques (356 results)
SSC CHSL 2021161)Some persons went on an outstation tour. The histogram shows their ages.
How many persons are less than 20 years of age?
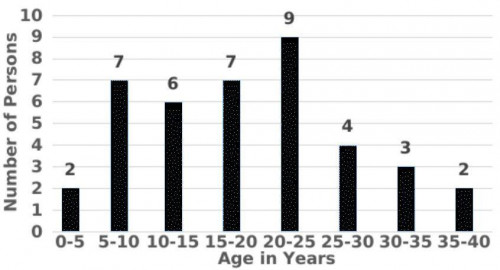
22
SSC CHSL 2021162)Study the given pie chart and answer the question that follows.
The pie chart shows the distribution (degree wise) of the number of computers sold by a shopkeeper during five months.
If the difference between the number of computers sold in May and the number of computers sold in February is x , then the value of x will be:
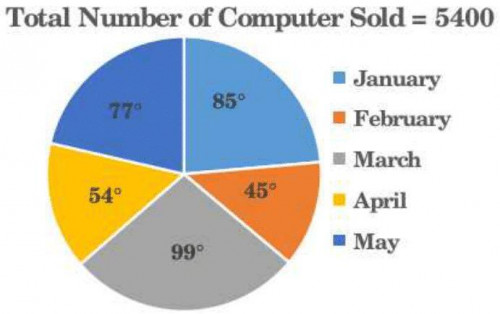
480
SSC CHSL 2021163)Study the following bar graph and answer the question given below.
The bar graph represents the total number of applications received for B.Sc. Mathematics by two different colleges A and B in 5 different year.
In 2015, out of the total number of applications received by colleges A and B together, only 60% were accepted, What were the total number of applications accepted by colleges A and B together in 2015?
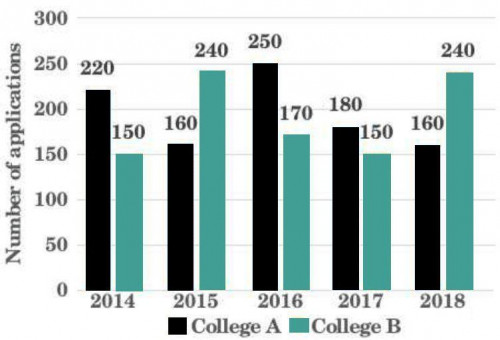
240
164)The line graph shows the production (in tonnes) and the sales (in tonnes) of a company.
What is the ratio of the productivity of the company in 2015 and 2016 taken together to the sales in 2017 and 2019 taken together?SSC CHSL 2021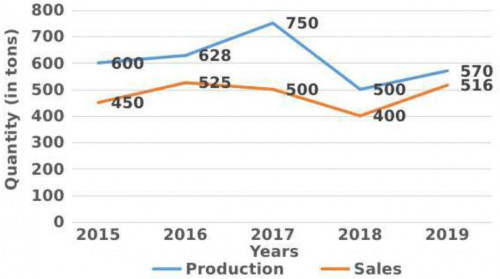
307 ∶ 254
SSC CHSL 2021165)Study the given graph and answer the question that follows.
The average number of computers of type B sold in January, February, and June exceeds by 20 the number of computers of type A sold in:
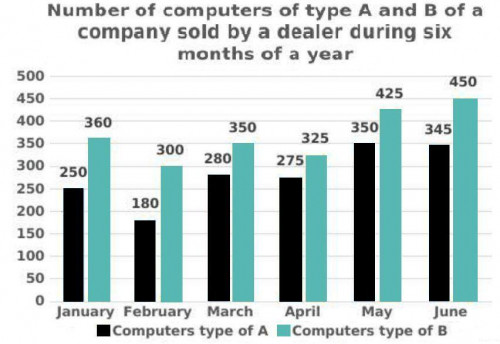
May
166)Study the given bar graphs and answer the question that follows.
The bar graphs represent the amount invested in raw materials (in Rs. crore) and the sale of the products, by a textile company in the years 2007-2012. The X-axis represents the years. The Y-axis represents the amount invested in raw materials (in Rs. crore) in figure 1 and the sale of products in figure 2, respectively.
In 2011, the sale of products had increased by a certain percentage with respect to the previous year. In 2012, by what percent should the sale of products increase from its present value so that it shows the same percent increase as had been shown in 2011?SSC CHSL 2021
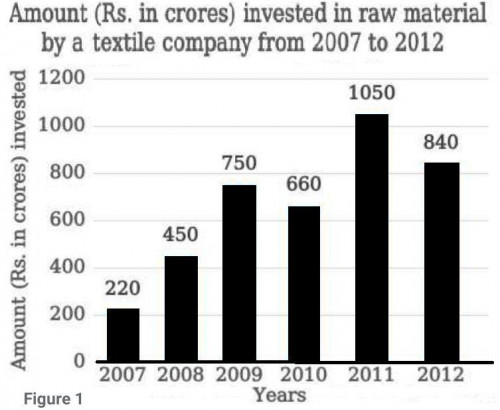
96
SSC CHSL 2021167)The number of students enrolled in different streams at Senior Secondary level in five schools is shown in the given bar graph.
What is the total number of students enrolled in the Science stream in all the schools?
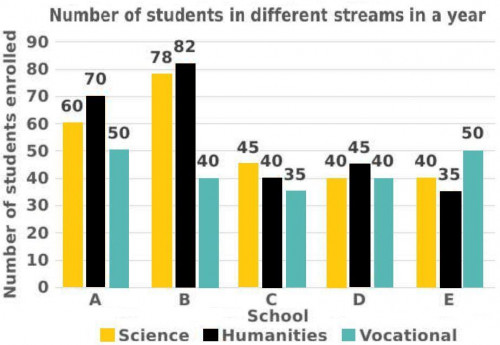
263
SSC CHSL 2021168)Study the given bar graph and answer the question that follows.
A tea plantation company produces three varieties of tea-black tea, green tea, and herbal tea. The production of three varieties (in million tonnes) over a period of six years from 2014 to 2019, has been shown in the bar graph here. The X-axis represents the years and the Y-axis displays the production of the three varieties in million tonnes.
The average production of black tea in 2014, 2015, and 2018 is how much more or less (in million tonnes) than the average production of green tea in 2016, 2017, and 2019?
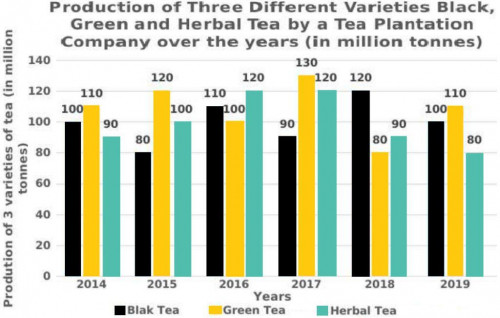
Less, 13.33
169)Study the given bar graphs and answer the question that follows.
The bar graphs represent the amount invested in raw materials (in Rs. crore) and the sale of the products, by a textile company in the years 2007- 2012. The X-axis represents the years. The Y-axis represents the amount invested in raw materials (in Rs, crore) in figure 1 and the sale of products in figure 2, respectively.
In which year was there a maximum percentage increase in the sales of products as compared to the previous year?SSC CHSL 2021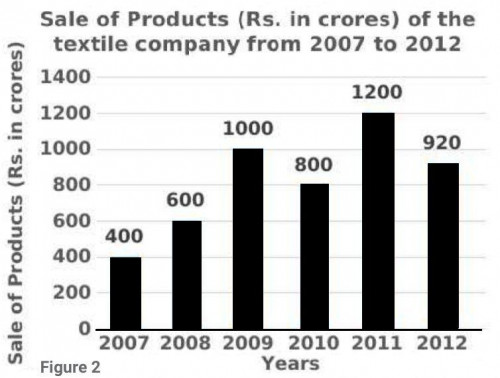

2009
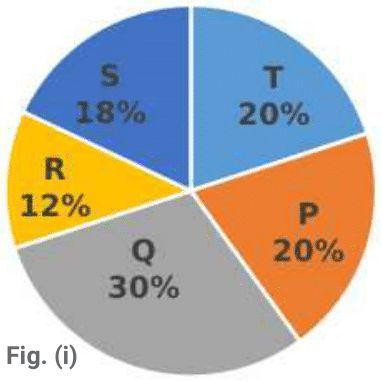
170)The given pie charts represent the distribution of candidates who enrolled for a bank clerical examination and the candidates (out of those enrolled) who passed the examination, from five different institutes P, Q, R, S and T. Study the pie charts and answer the question that follows.
(i) Total number of candidates who enrolled for the examination from five institutes = 5500
(ii) Total number of candidates who passed the examination from five institutes = 3300
Which institute(s) has/have the highest percentage of candidates passed to the candidates enrolled?SSC CHSL 2021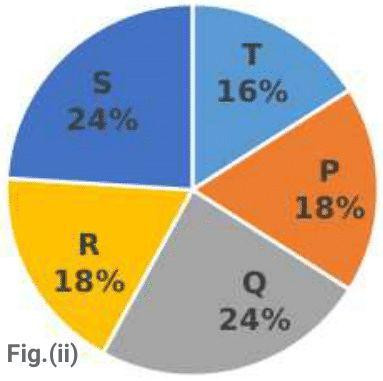
 of the number of computers sold by a shopkeeper during five months.<br><img class="img-fluid pr-2 py-1 qImg extra-img" src="https://scorekhel.com/storage/practiceQuestion/Que7125/eng/extra-image.jpg" /><br>If the difference between the number of computers sold in May and the number of computers sold in February is x , then the value of x will be:)
 of the number of computers sold by a shopkeeper during five months.<br><img class=\"img-fluid pr-2 py-1 qImg extra-img\" src=\"https://scorekhel.com/storage/practiceQuestion/Que7125/eng/extra-image.jpg\" /><br>If the difference between the number of computers sold in May and the number of computers sold in February is x , then the value of x will be:**%0D%0AA%29 450%0D%0AB%29 420%0D%0AC%29 540%0D%0AD%29 480 %0D%0AClick Link for Answer)
 and the sale of the products, by a textile company in the years 2007-2012. The X-axis represents the years. The Y-axis represents the amount invested in raw materials (in Rs. crore) in figure 1 and the sale of products in figure 2, respectively.<br><img class="img-fluid pr-2 py-1 qImg extra-img" src="https://scorekhel.com/storage/practiceQuestion/Que7217/eng/extra-image.jpg" /><br>In 2011, the sale of products had increased by a certain percentage with respect to the previous year. In 2012, by what percent should the sale of products increase from its present value so that it shows&nbsp;the same percent increase as had been shown in 2011?)
 and the sale of the products, by a textile company in the years 2007-2012. The X-axis represents the years. The Y-axis represents the amount invested in raw materials (in Rs. crore) in figure 1 and the sale of products in figure 2, respectively.<br><img class=\"img-fluid pr-2 py-1 qImg extra-img\" src=\"https://scorekhel.com/storage/practiceQuestion/Que7217/eng/extra-image.jpg\" /><br>In 2011, the sale of products had increased by a certain percentage with respect to the previous year. In 2012, by what percent should the sale of products increase from its present value so that it shows&nbsp;the same percent increase as had been shown in 2011?**%0D%0AA%29 98%0D%0AB%29 95%0D%0AC%29 96%0D%0AD%29 94 %0D%0AClick Link for Answer)
 over a period of six years from 2014 to 2019, has been shown in the bar graph here. The X-axis represents the years and the Y-axis displays the production of the three varieties in million tonnes.<br><img class="img-fluid pr-2 py-1 qImg extra-img" src="https://scorekhel.com/storage/practiceQuestion/Que7303/eng/extra-image.jpg" /><br>The average production of black tea in 2014, 2015, and 2018 is how much more or less (in million tonnes) than the average production of green tea in 2016, 2017, and 2019?)
 over a period of six years from 2014 to 2019, has been shown in the bar graph here. The X-axis represents the years and the Y-axis displays the production of the three varieties in million tonnes.<br><img class=\"img-fluid pr-2 py-1 qImg extra-img\" src=\"https://scorekhel.com/storage/practiceQuestion/Que7303/eng/extra-image.jpg\" /><br>The average production of black tea in 2014, 2015, and 2018 is how much more or less (in million tonnes) than the average production of green tea in 2016, 2017, and 2019?**%0D%0AA%29 Less, 12.33%0D%0AB%29 Less, 13.33%0D%0AC%29 More, 12.33%0D%0AD%29 More, 13.33 %0D%0AClick Link for Answer)
 and the sale of the products, by a textile company in the years 2007-&nbsp;2012. The X-axis represents the years. The Y-axis represents the amount invested in raw materials (in Rs,&nbsp;crore) in figure 1 and the sale of products in figure 2, respectively.<br><img class="img-fluid pr-2 py-1 qImg extra-img" src="https://scorekhel.com/storage/practiceQuestion/Que7310/eng/extra-image.jpg" /><br>In which year was there a maximum percentage increase in the sales of products as compared to the previous year?)
 and the sale of the products, by a textile company in the years 2007-&nbsp;2012. The X-axis represents the years. The Y-axis represents the amount invested in raw materials (in Rs,&nbsp;crore) in figure 1 and the sale of products in figure 2, respectively.<br><img class=\"img-fluid pr-2 py-1 qImg extra-img\" src=\"https://scorekhel.com/storage/practiceQuestion/Que7310/eng/extra-image.jpg\" /><br>In which year was there a maximum percentage increase in the sales of products as compared to the previous year?**%0D%0AA%29 2009%0D%0AB%29 2011%0D%0AC%29 2008%0D%0AD%29 2010 %0D%0AClick Link for Answer)
 who passed the examination, from five different institutes P, Q, R, S and T. Study the pie charts and answer the question that follows.<br> (i) Total number of candidates who enrolled for the examination from five institutes = 5500<br><img class="img-fluid pr-2 py-1 qImg extra-img" src="https://scorekhel.com/storage/practiceQuestion/Que7311/eng/extra-image.jpg" /><br>(ii) Total number of candidates who passed the examination from five institutes = 3300<br>Which institute(s) has/have the highest percentage of candidates passed to the candidates enrolled?)
 who passed the examination, from five different institutes P, Q, R, S and T. Study the pie charts and answer the question that follows.<br> (i) Total number of candidates who enrolled for the examination from five institutes = 5500<br><img class=\"img-fluid pr-2 py-1 qImg extra-img\" src=\"https://scorekhel.com/storage/practiceQuestion/Que7311/eng/extra-image.jpg\" /><br>(ii) Total number of candidates who passed the examination from five institutes = 3300<br>Which institute(s) has/have the highest percentage of candidates passed to the candidates enrolled?**%0D%0AA%29 P%0D%0AB%29 R%0D%0AC%29 Q and T%0D%0AD%29 S %0D%0AClick Link for Answer)
R