objective Ques (356 results)
SSC CHSL 2021151)A soft drink company prepares drinks of three different flavours - A, B and C. The production of the three flavours over a period of five years from 2010 to 2014 has been expressed in the given bar graph. Study the graph and answer the question that follows.
Production of three different flavours A, B and C (in lakh bottles) by a company over five years.
What was the approximate percentage decline in the production of flavour A in 2013 as compared to the production of flavour A in 2011?
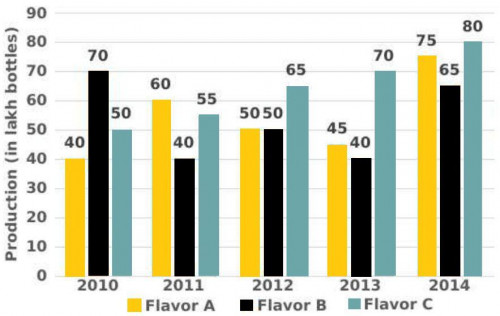
25%
SSC CHSL 2021152)Study the given bar graph which shows the lifetime (in hours) of neon lamps and the number of neon lamps and answer the question that follows.
The number of neon lamps having life 500 hours or more but less than 700 hours is what percent of the total number of neon lamps having life 800 hours or more?
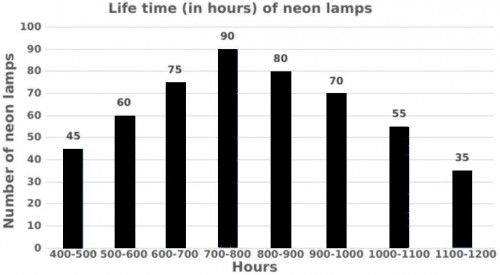
56.25%
SSC CHSL 2021153)The given bar graph shows the production of table fans in a factory during one week. Study the bar graph and answer the question that follows.
The average production of table fans from Monday to Wednesday is approximately what percentage more than the average production of table fans from Thursday to Saturday?
(correct to one decimal place)
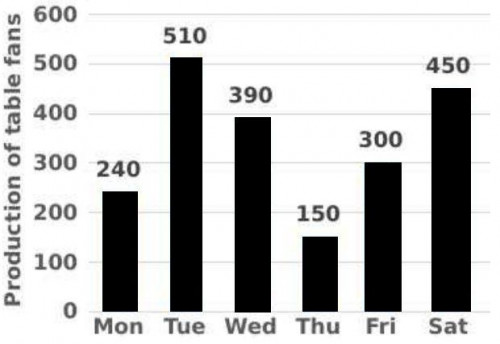
26.7%
SSC CHSL 2021154)Study the following graph and answer the question that follows.
Number of students that appeared and qualified, from various colleges, at a scholarship examination.
The number of students that appeared for the scholarship exam from College X is what percentage of the total number of students that appeared for the exam from all the colleges together?
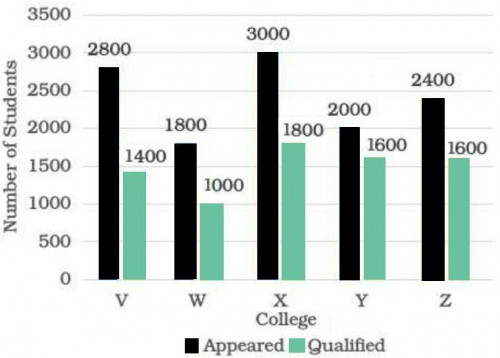
25
SSC CHSL 2021155)Study the given graph and answer the question that follows.
The chart represents the demand and production of leather bags by five companies U, V, X, Y, and Z.
The difference between the average demand and average production of the five companies taken together is:
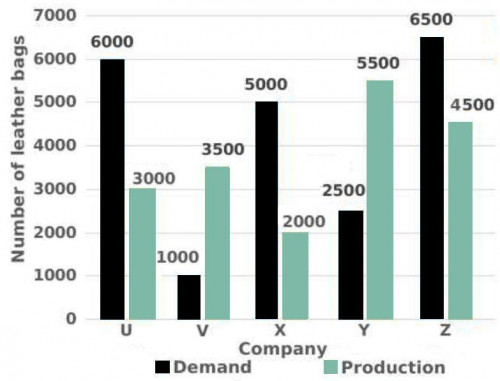
500
SSC CHSL 2021156)Study the given graph and answer the question that follows.
The chart represents the demand and production of leather bags by five companies U, V, X, Y, and Z.
If h% of the demand of leather bags for company X equals the demand of the leather bags for company V, then h equals:

20
SSC CHSL 2021157)Study the given pie chart and the table and answer the question that follows.
The pie chart represents the percentage-wise distribution of 300 students of class X in a school in six different sections A, B, C, D, E, and F.
The table shows the number of boys of class X in six different sections A, B, C, D, E, and F.
If the total number of students in section C is 57, then the total number of girls in sections C and D together will be:
Section A B C D E F No. of boys 36 26 34 28 _______ 20
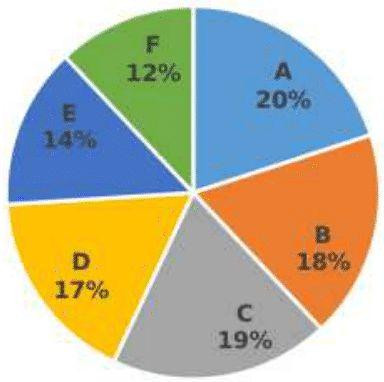
46
SSC CHSL 2021158)Study the given pie-chart and answer the question that follows.
The pie-chart represents the percentage distribution of candidates qualified in a bank examination from six different districts of a State in 2016. The total number of qualified candidates from the State is 68000.
What is the difference (to the nearest whole number) between the average number of qualified students from Districts A, C, and F and the average number of qualified students from Districts B, D, and E?
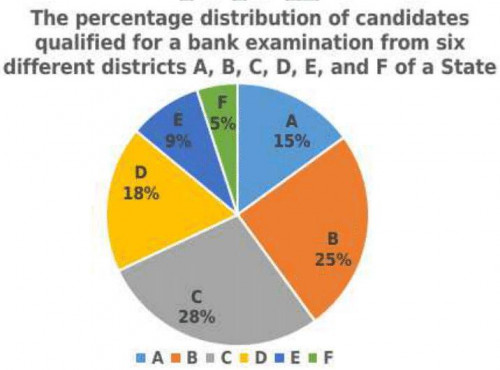
907
SSC CHSL 2021159)Study the given pie chart and answer the question that follows.
The total number of students admitted to a college = 700.
Distribution of the percentage of students in various courses.
Percentage-wise distribution of the number of boys.
The ratio of the total number of girls admitted in B.Sc. Maths to the total number of students admitted in B.Sc. Maths is:
Course Number of boys B.Sc. Maths 40% B.Sc. Physics 68% B.Sc. Chemistry 58% B.Sc. Computer Science 80% B.Com. 75% BBA 65%
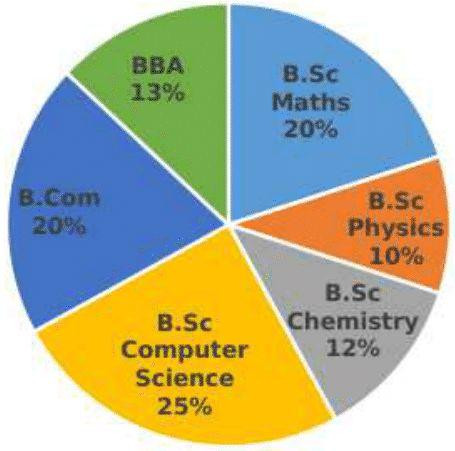
3 ∶ 5
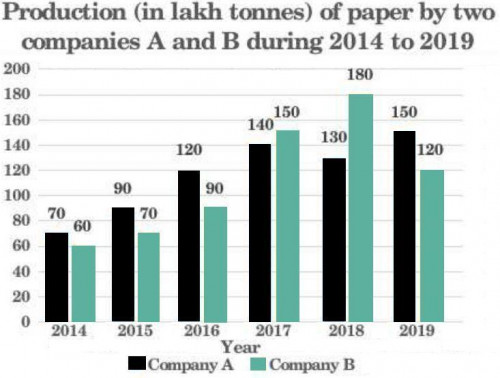
SSC CHSL 2021160)Study the given graph and answer the question that follows.
The total production of paper by company B in 2015 and 2017 to 2019 was what percentage less than 90% of the total production of paper by company A in 2014 to 2019 (correct to one decimal place)?
 by a company over five years.<br><img class="img-fluid pr-2 py-1 qImg extra-img" src="https://scorekhel.com/storage/practiceQuestion/Que6916/eng/extra-image.jpg" /><br>What was the approximate percentage decline in the production of flavour A in 2013 as compared to the production of flavour A in 2011?)
 by a company over five years.<br><img class=\"img-fluid pr-2 py-1 qImg extra-img\" src=\"https://scorekhel.com/storage/practiceQuestion/Que6916/eng/extra-image.jpg\" /><br>What was the approximate percentage decline in the production of flavour A in 2013 as compared to the production of flavour A in 2011?**%0D%0AA%29 25%%0D%0AB%29 24%%0D%0AC%29 30%%0D%0AD%29 20% %0D%0AClick Link for Answer)
 of neon lamps and the number of neon lamps and answer the question that follows.<br><img class="img-fluid pr-2 py-1 qImg extra-img" src="https://scorekhel.com/storage/practiceQuestion/Que6920/eng/extra-image.jpg" /><br>The number of neon lamps having life 500 hours or more but less than 700 hours is what percent of the total number of neon lamps having life 800 hours or more?)
 of neon lamps and the number of neon lamps and answer the question that follows.<br><img class=\"img-fluid pr-2 py-1 qImg extra-img\" src=\"https://scorekhel.com/storage/practiceQuestion/Que6920/eng/extra-image.jpg\" /><br>The number of neon lamps having life 500 hours or more but less than 700 hours is what percent of the total number of neon lamps having life 800 hours or more?**%0D%0AA%29 61.55%%0D%0AB%29 51.85%%0D%0AC%29 56.25%%0D%0AD%29 57.75% %0D%0AClick Link for Answer)
)
**%0D%0AA%29 25%%0D%0AB%29 27.5%%0D%0AC%29 26.7%%0D%0AD%29 28% %0D%0AClick Link for Answer)
 between the average number of qualified students from&nbsp;Districts A, C, and F and the average number of qualified students from Districts B, D, and E?)
 between the average number of qualified students from&nbsp;Districts A, C, and F and the average number of qualified students from Districts B, D, and E?**%0D%0AA%29 910%0D%0AB%29 907%0D%0AC%29 906%0D%0AD%29 900 %0D%0AClick Link for Answer)
?)
?**%0D%0AA%29 22.4%%0D%0AB%29 17.5%%0D%0AC%29 21.2%%0D%0AD%29 19.6% %0D%0AClick Link for Answer)
17.5%