objective Ques (356 results)
SSC CHSL 2021131)Study the following graph and answer the question that follows.
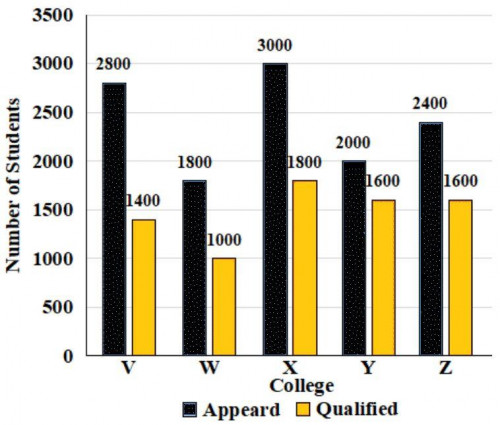
Number of students that appeared and qualified, from various colleges, at a scholarship examination.
The average number of students that qualified in the examination from Colleges X and Y is what percentage of the average number of students that appeared for the examination from the same colleges?
68
SSC CHSL 2021132)Study the given bar graph and answer the question that follows.
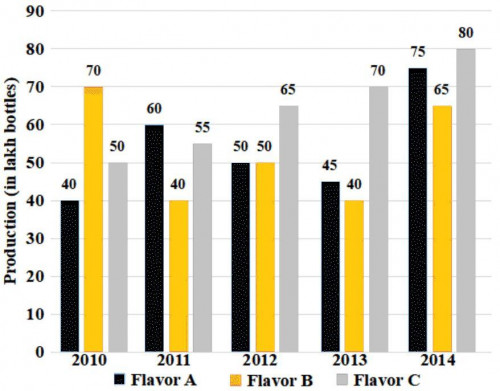
A soft drink company prepares drinks of three different flavours A, B and C. The bar graph shows the production of three flavours over a period of five years from 2010 to 2014.
Production of three different flavours A, B and C by a company over the five years (in lakh bottles).
What percentage of the total production of soft drink of flavour A in 2013 and 2014 is the total production of soft drink of flavour B in 2011 and 2012?
75%
133)Study the given bar graphs and answer the question that follows.
The bar graphs represent the amount invested in raw materials (in Rs. crore) and the sale of the products, by a textile company in the year 2007 - 2012. The X-axis represents the years. The Y-axis represents the amount invested in raw materials (in Rs. crore) in figure 1 and sale of products in figure 2, respectively.
In which two years was the difference of the amount invested and the sales of products the same?SSC CHSL 2021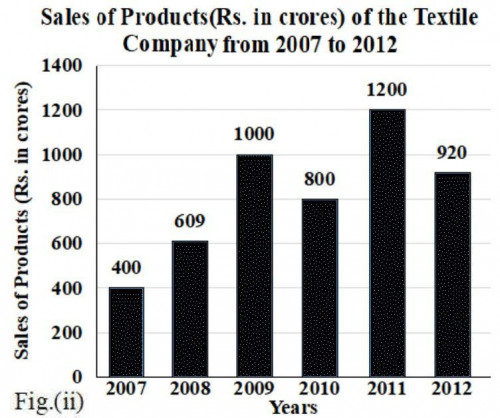

2008 & 2011
SSC CHSL 2021134)Study the given graph and answer the question that follows.
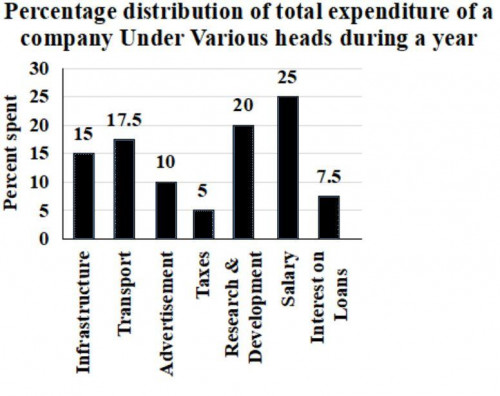
What is the ratio of the total expenditure on Infrastructure and Transport to the total expenditure on Taxes and Interest on Loans?
13 : 5
SSC CHSL 2021135)Study the given graph and answer the question that follows.
By what percentage is the average expenditure of the company in 2014, 2016 and 2018 less than the revenue in 2017?
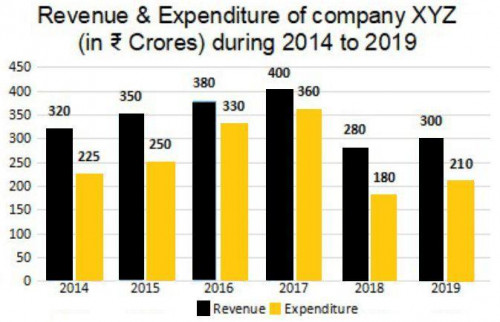
38.75%
136)The number of students enrolled in different streams at the Senior Secondary level in five schools is shown in the bar graph.
What is the ratio of the number of students of science stream of schools A, B, and D taken together to the number of students of vocational stream in schools B, D, and E has taken together?SSC CHSL 2021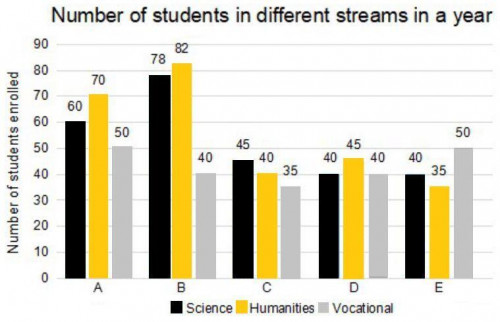
89 ∶ 65
SSC CHSL 2021137)Study the given bar graph and answer the question that follows.
The bar graph shows the exports of cars of types A and B (in Rs. million).
What is the ratio of the total exports of cars of type A in 2016 and 2018 to the total exports of cars of type B in 2015 and 2017?
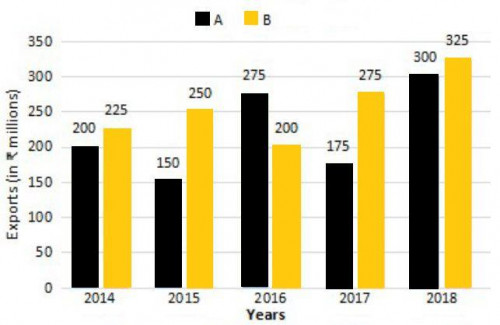
23 ∶ 21
138)Students of Primary, Middle, Secondary, and Sr. Secondary classes collected donations for a Relief Fund as shown in the given pie chart. If the donation collected from the Middle classes was Rs. 6,750, then how much more money was collected by Middle classes as compared to Secondary classes?
SSC CHSL 2021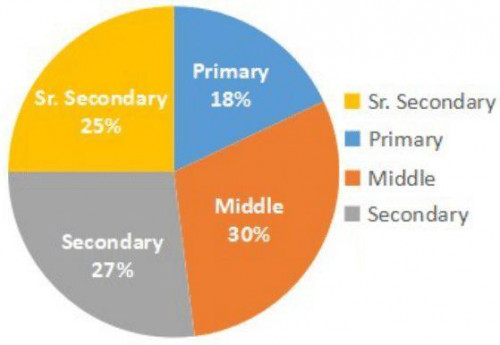
Rs. 675
SSC CHSL 2021139)The histogram shows the marks scored by 40 students in a test with maximum 30 marks.
What is the percentage of the students who scored less than 20 marks?
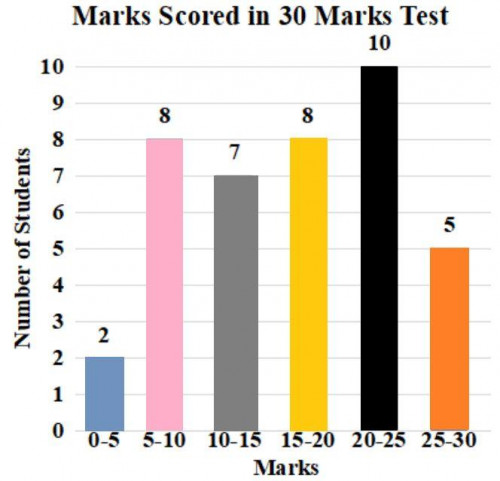
62.5
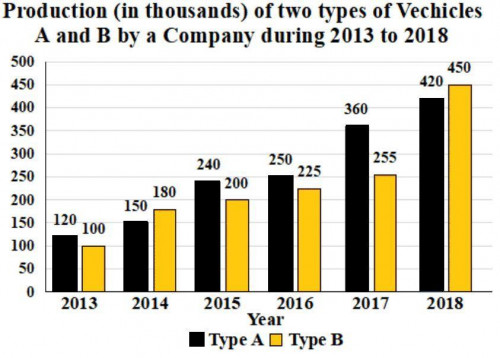
SSC CHSL 2021140)Study the given graph and answer the question that follows.
\(31\frac{1}{4}\%\) of the total number of vehicles of type A produced in 2013, 2015 and 2017 is equal to the number of vehicles of type B produced in the year:
.<br><img class="img-fluid pr-2 py-1 qImg extra-img" src="https://scorekhel.com/storage/practiceQuestion/Que6420/eng/extra-image.jpg" /><br>What percentage of the total production of soft drink of flavour A in 2013 and 2014 is the total production of soft drink of flavour B in 2011 and 2012?)
.<br><img class=\"img-fluid pr-2 py-1 qImg extra-img\" src=\"https://scorekhel.com/storage/practiceQuestion/Que6420/eng/extra-image.jpg\" /><br>What percentage of the total production of soft drink of flavour A in 2013 and 2014 is the total production of soft drink of flavour B in 2011 and 2012?**%0D%0AA%29 75%%0D%0AB%29 70%%0D%0AC%29 55%%0D%0AD%29 60% %0D%0AClick Link for Answer)
 and the sale of the products, by a textile company in the year 2007 - 2012. The X-axis represents the years. The Y-axis represents the amount invested in raw materials (in Rs. crore) in figure 1 and sale of products in figure 2, respectively.<br><img class="img-fluid pr-2 py-1 qImg extra-img" src="https://scorekhel.com/storage/practiceQuestion/Que6438/eng/extra-image.jpg" /><br>In which two years was the difference of the amount invested and the sales of products the same?)
 and the sale of the products, by a textile company in the year 2007 - 2012. The X-axis represents the years. The Y-axis represents the amount invested in raw materials (in Rs. crore) in figure 1 and sale of products in figure 2, respectively.<br><img class=\"img-fluid pr-2 py-1 qImg extra-img\" src=\"https://scorekhel.com/storage/practiceQuestion/Que6438/eng/extra-image.jpg\" /><br>In which two years was the difference of the amount invested and the sales of products the same?**%0D%0AA%29 2007 & 2009%0D%0AB%29 2009&nbsp;& 2012%0D%0AC%29 2008&nbsp;& 2011%0D%0AD%29 2010&nbsp;& 2011 %0D%0AClick Link for Answer)
.<br><img class="img-fluid pr-2 py-1 qImg extra-img" src="https://scorekhel.com/storage/practiceQuestion/Que6540/eng/extra-image.jpg" /><br>What is the ratio of the total exports of cars of type A in 2016 and 2018 to the total exports of cars of type B in 2015 and 2017?)
.<br><img class=\"img-fluid pr-2 py-1 qImg extra-img\" src=\"https://scorekhel.com/storage/practiceQuestion/Que6540/eng/extra-image.jpg\" /><br>What is the ratio of the total exports of cars of type A in 2016 and 2018 to the total exports of cars of type B in 2015 and 2017?**%0D%0AA%29 15&nbsp;∶ 29%0D%0AB%29 21&nbsp;∶ 23%0D%0AC%29 23&nbsp;∶ 21%0D%0AD%29 18&nbsp;∶ 23 %0D%0AClick Link for Answer)
 of the total number of vehicles of type A produced in 2013, 2015 and 2017 is equal to the number of vehicles of type B produced in the year:)
2016