objective Ques (356 results)
121)The histogram shows the marks scored by 40 students in a test with a maximum of 30 marks. How many students scored 10 or more marks?
SSC CHSL 2021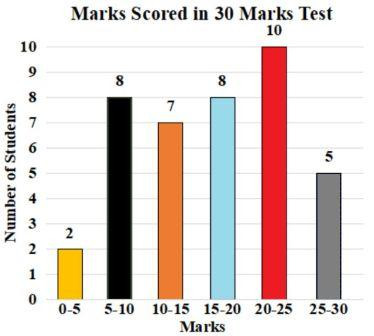
30
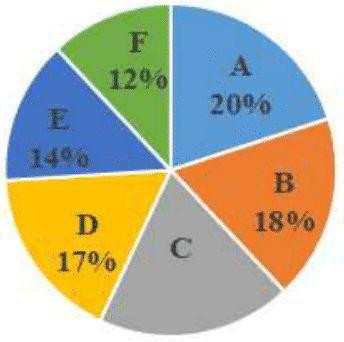
SSC CHSL 2021122)The following pie chart represents the percentage-wise distribution of 300 students of class X in a school in six different sections A, B, C, D, E, and F.
The given table shows the number of boys of class X in six different sections A, B, C, D, E and F.
Section A B C D E F No. of boys 36 26 34 28 ---- 20
The total number of boys in sections A, B and D together is what percentage more than the total number of girls in sections A, B and D together?
20%
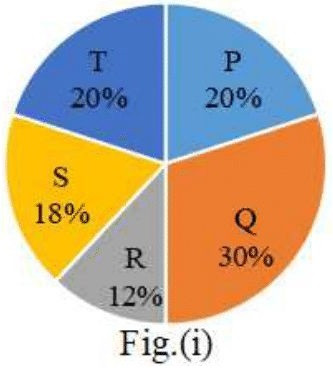
123)Study the given pie chart and answer the question that follow.
The pie charts represents the distribution of candidates who were enrolled for Bank Clerical Examination Fig(i) and the candidates (out of those enrolled) who passed the examination Fig(ii) in five different institutions P, Q, R, S and T.
(I) total number of candidates enrolled in five different institutes = 5500
(II) Total number of candidates who passed the examination from five institutes = 3300
The percentage of the candidates who passed to the number of candidates enrolled for institutes P and T together is:SSC CHSL 2021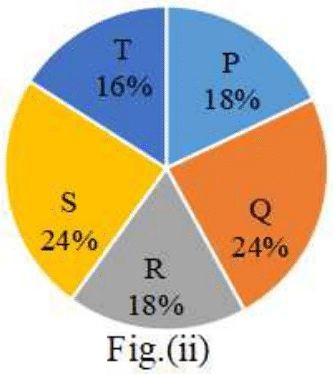
51%
SSC CHSL 2021124)Study the given graph and answer the questions that follows.
For which of the following years was the increase in the production of sugar as compared to that in its preceding year between 8%and 10%?
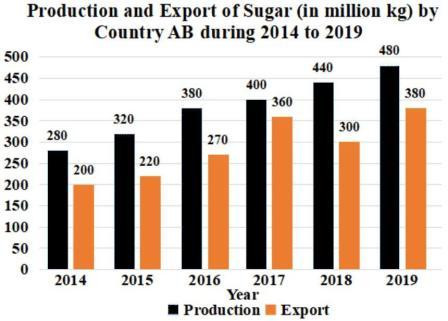
2019
SSC CHSL 2021125)Study the given bar graph and answer the questions that follows.
What is the ratio of the boys taken together in colleges A, B and C to the girls taken together in all 5 colleges?
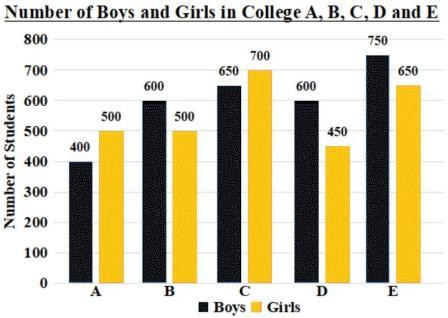
33 : 56
SSC CHSL 2021126)Study the given bar graph and answer the questions that follows.
In which year was the percentage increase in production as compared to the previous year, the maximum?
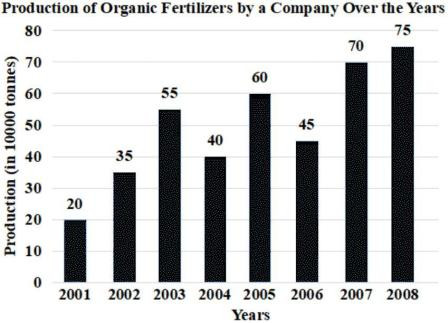
2002
SSC CHSL 2021127)Study the given bar graph and answer the question that follows.
The bar graph indicates the production of sugar (in lakh tonnes) by three different sugar companies P, Q and R over the years 2015 to 2019.
The percentage rise in the production of sugar by company Q as compares to the previous year is maximum in the year:
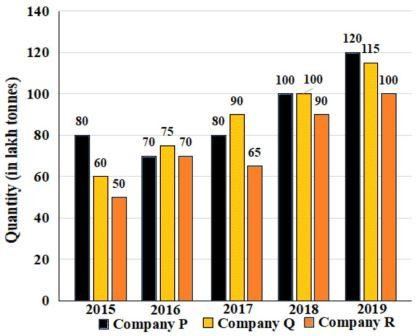
2016
SSC CHSL 2021128)The number of students enrolled in different streams at Senior Secondary level in five schools is shown in the bar graph.
In which school is the number of students the least?

C
129)The number of students enrolled in different streams at Senior Secondary level in five schools has been shown in the bar graph.
What percentage of the total number of students in all the streams taken together in all the five schools to the number of students enrolled in the science stream in school A?SSC CHSL 2021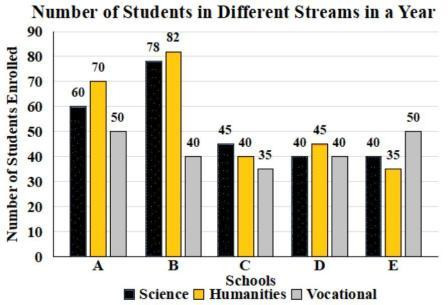
8
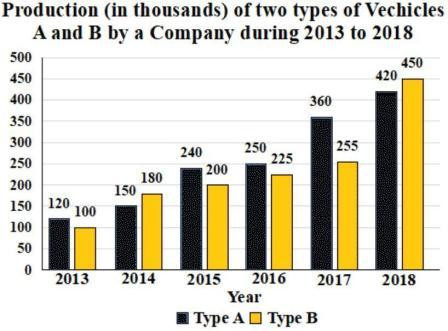
SSC CHSL 2021130)Study the given graph and answer the question that follows.
By what percentage (approximately) is the average number of vehicles of type B produced in 2014, 2016 and 2018 less than the number of vehicles of type A produced in 2017?
 and the candidates (out of those enrolled) who passed the examination Fig(ii) in five different institutions P, Q, R, S and T.<br> (I) total number of candidates enrolled in five different institutes = 5500<br><img class="img-fluid pr-2 py-1 qImg extra-img" src="https://scorekhel.com/storage/practiceQuestion/Que6164/eng/extra-image.jpg" /><br>(II) Total number of candidates who passed the examination from five institutes = 3300<br>The percentage of the candidates who passed to the number of candidates enrolled for institutes P and T together is:)
 and the candidates (out of those enrolled) who passed the examination Fig(ii) in five different institutions P, Q, R, S and T.<br> (I) total number of candidates enrolled in five different institutes = 5500<br><img class=\"img-fluid pr-2 py-1 qImg extra-img\" src=\"https://scorekhel.com/storage/practiceQuestion/Que6164/eng/extra-image.jpg\" /><br>(II) Total number of candidates who passed the examination from five institutes = 3300<br>The percentage of the candidates who passed to the number of candidates enrolled for institutes P and T together is:**%0D%0AA%29 54%%0D%0AB%29 50%%0D%0AC%29 51%%0D%0AD%29 52% %0D%0AClick Link for Answer)
 by three different sugar companies P, Q and R over the years 2015 to 2019.<br><img class="img-fluid pr-2 py-1 qImg extra-img" src="https://scorekhel.com/storage/practiceQuestion/Que6312/eng/extra-image.jpg" /><br>The percentage rise in the production of sugar by company Q as compares to the previous year is maximum in the year:)
 by three different sugar companies P, Q and R over the years 2015 to 2019.<br><img class=\"img-fluid pr-2 py-1 qImg extra-img\" src=\"https://scorekhel.com/storage/practiceQuestion/Que6312/eng/extra-image.jpg\" /><br>The percentage rise in the production of sugar by company Q as compares to the previous year is maximum in the year:**%0D%0AA%29 2016%0D%0AB%29 2017%0D%0AC%29 2019%0D%0AD%29 2018 %0D%0AClick Link for Answer)
 is the average number of vehicles of type B produced in 2014, 2016 and 2018 less than the number of vehicles of type A produced in 2017?)
 is the average number of vehicles of type B produced in 2014, 2016 and 2018 less than the number of vehicles of type A produced in 2017?**%0D%0AA%29 20.8%0D%0AB%29 18.6%0D%0AC%29 21.4%0D%0AD%29 23.6 %0D%0AClick Link for Answer)
20.8