objective Ques (356 results)
111)The given line graph shows the production (in tonnes) and the sales (in tonnes) of a company.
How much more is the production in 2015 and 2017 taken together than the sales in 2016 and 2018 taken together (in tonnes)?SSC CHSL 2021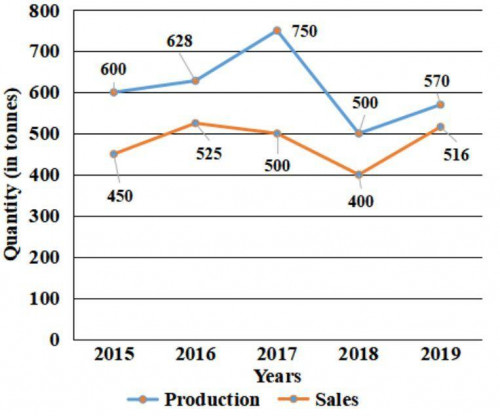
425
SSC CHSL 2021112)Study the given bar graph and answer the question that follows.
A tea plantation company produces three varieties of tea - black tea, green tea and herbal tea. The production of three varieties (in million tonnes) over a period of six years from 2014 to 2019, has been shown in the bar graph here. The X-axis represents the years and the Y-axis displays the production of the three varieties in million tonnes.
The total production of green tea in 2016 and 2018 is what percent of the total production of herbal tea in 2015 and 2017?
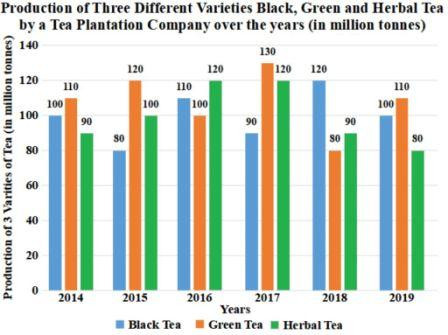
81.8
SSC CHSL 2021113)The line graph shows the production (in tonnes) and the sales (in tonnes) of a company.
What is the percentage of maximum increase or reduction in the production of the company in comparison to the previous year?

33.33% reduction
SSC CHSL 2021114)A soft drink company prepares drinks of three different flavours - A, B, C. The production of the three flavours over a period of five years from 2010 to 2014 has been expressed in the given bar graph. Study the graph and answer the question that follows.
Production of three different flavours A, B and C (in lakh bottles) by a company over five years.
The difference between the average production of flavour A in 2012, 2013 and 2014 and the average production of flavour C in 2012, 2013 and 2014 is:
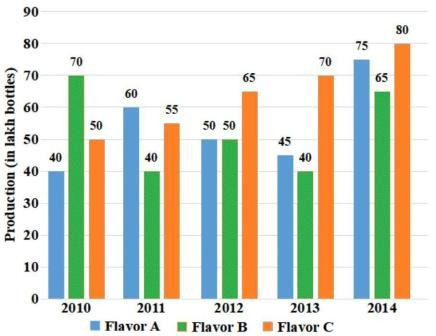
15 lakh bottles
SSC CHSL 2021115)The following histogram represents the distribution of total household expenditure (in Rs.) of 200 manual workers in a city.
The number of workers whose total expenditure is Rs. 350 and above is what percentage less than the number of workers whose total expenditure is less than Rs. 250?
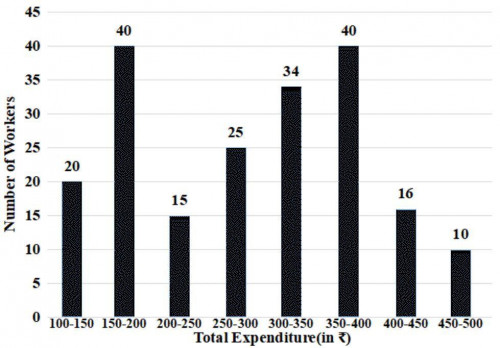
12%
SSC CHSL 2021116)Study the following graph and answer the question that follows.
Marks scored by five students in three subjects (Maths, English, and Physics). Total marks for each subject are 100.
What is the difference between the total marks obtained by B and the total marks obtained by C?
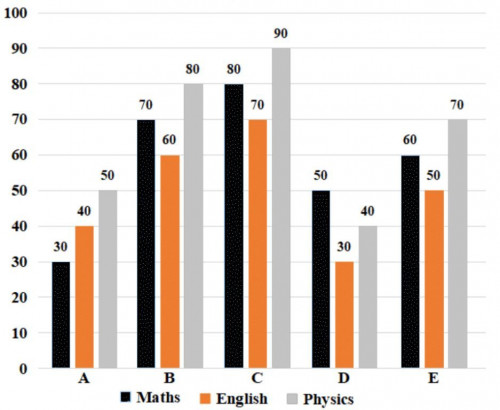
30
SSC CHSL 2021117)The histogram given below presents the frequency distribution of average runs scored by 50 selected players from a district in local cricket tournament.
Study the histogram and answer the question that follows.
How many players scored 30.5 runs or less?
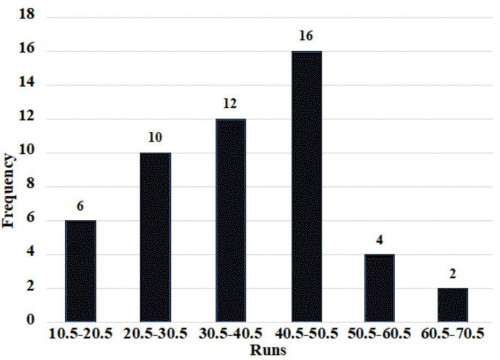
16
SSC CHSL 2021118)Study the line graph and answer the question that follows.
The line graph represents the number of vehicles (in thousands) manufactured by two automobile companies A and B over the years from 2010 to 2015. The X-axis represents the years and the Y-axis represents number of vehicles in thousands.
(The data shown here is only for mathematical exercise. They do not represent the actual figures of the country.)
Company B is projecting an increase in the number of vehicles to be manufactured in 2016 by 70% with respect to its average number of vehicles from 2010 to 2015. What should be the approximate percentage increase in the number of vehicles (in thousands) to be manufactured by Company A in 2016 with respect to the number of vehicles in 2015, so that it is at par with Company B?
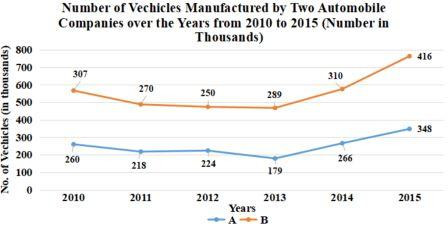
50
SSC CHSL 2021119)Study the given pie chart and answer the question that follows.
The pie chart shows the distribution (degree wise) of the number of computers sold by a shopkeeper during five months.
By what percentage is the total number of computers sold in February and March more than the number of computers sold in April and May (correct to one decimal place)?
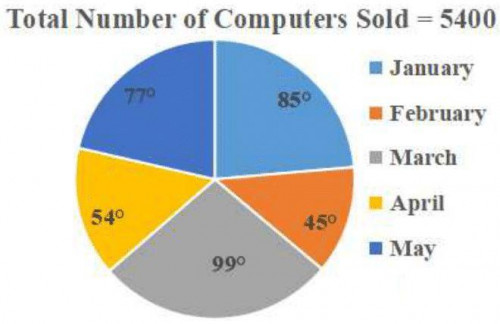
9.9%
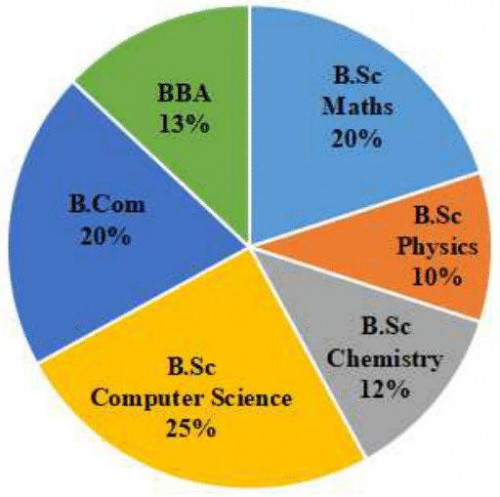
SSC CHSL 2021120)Study the given pie chart and answer the question that follows.
The Total number of students admitted to a college = 700.
Distribution of the percentage of students in various courses.
Percentage-wise distribution of the number of boys.
Course Number of boys B.Sc. Maths 40% B.Sc. Physics 68% B.Sc. Chemistry 58% B.Sc. Computer Science 80% B.Com. 75% BBA 65%
The difference between the number of boys and the number of girls admitted in B.Com. is:
 over a period of six years from 2014 to 2019, has been shown in the bar graph here. The X-axis represents the years and the Y-axis displays the production of the three varieties in million tonnes.<br><img class="img-fluid pr-2 py-1 qImg extra-img" src="https://scorekhel.com/storage/practiceQuestion/Que5909/eng/extra-image.jpg" /><br>The total production of green tea in 2016 and 2018 is what percent of the total production of herbal tea in 2015 and 2017?)
 over a period of six years from 2014 to 2019, has been shown in the bar graph here. The X-axis represents the years and the Y-axis displays the production of the three varieties in million tonnes.<br><img class=\"img-fluid pr-2 py-1 qImg extra-img\" src=\"https://scorekhel.com/storage/practiceQuestion/Que5909/eng/extra-image.jpg\" /><br>The total production of green tea in 2016 and 2018 is what percent of the total production of herbal tea in 2015 and 2017?**%0D%0AA%29 79.7%0D%0AB%29 85.6%0D%0AC%29 81.8%0D%0AD%29 83.4 %0D%0AClick Link for Answer)
 and the sales (in tonnes) of a company.<br><img class="img-fluid pr-2 py-1 qImg extra-img" src="https://scorekhel.com/storage/practiceQuestion/Que5919/eng/extra-image.jpg" /><br>What is the percentage of maximum increase or reduction in the production of the company in comparison to the previous year?)
 and the sales (in tonnes) of a company.<br><img class=\"img-fluid pr-2 py-1 qImg extra-img\" src=\"https://scorekhel.com/storage/practiceQuestion/Que5919/eng/extra-image.jpg\" /><br>What is the percentage of maximum increase or reduction in the production of the company in comparison to the previous year?**%0D%0AA%29 33.33% reduction%0D%0AB%29 46.67% reduction%0D%0AC%29 29% increase%0D%0AD%29 50% increase %0D%0AClick Link for Answer)
 by a company over five years.<br><img class="img-fluid pr-2 py-1 qImg extra-img" src="https://scorekhel.com/storage/practiceQuestion/Que5922/eng/extra-image.jpg" /><br>The difference between the average production of flavour A in 2012, 2013 and 2014 and the average production of flavour C in 2012, 2013 and 2014 is:)
 by a company over five years.<br><img class=\"img-fluid pr-2 py-1 qImg extra-img\" src=\"https://scorekhel.com/storage/practiceQuestion/Que5922/eng/extra-image.jpg\" /><br>The difference between the average production of flavour A in 2012, 2013 and 2014 and the average production of flavour C in 2012, 2013 and 2014 is:**%0D%0AA%29 12 lakh bottles%0D%0AB%29 10 lakh bottles%0D%0AC%29 18 lakh bottles%0D%0AD%29 15 lakh bottles %0D%0AClick Link for Answer)
 of 200 manual workers in a city.<br><img class="img-fluid pr-2 py-1 qImg extra-img" src="https://scorekhel.com/storage/practiceQuestion/Que6048/eng/extra-image.jpg" /><br>The number of workers whose total expenditure is Rs. 350 and above is what percentage less than the number of workers whose total expenditure is less than Rs. 250?)
 of 200 manual workers in a city.<br><img class=\"img-fluid pr-2 py-1 qImg extra-img\" src=\"https://scorekhel.com/storage/practiceQuestion/Que6048/eng/extra-image.jpg\" /><br>The number of workers whose total expenditure is Rs. 350 and above is what percentage less than the number of workers whose total expenditure is less than Rs. 250?**%0D%0AA%29 15%%0D%0AB%29 12%%0D%0AC%29 10%%0D%0AD%29 14% %0D%0AClick Link for Answer)
. Total marks for each subject are 100.<br><img class="img-fluid pr-2 py-1 qImg extra-img" src="https://scorekhel.com/storage/practiceQuestion/Que6054/eng/extra-image.jpg" /><br> What is the difference between the total marks obtained by B and the total marks obtained by C?)
. Total marks for each subject are 100.<br><img class=\"img-fluid pr-2 py-1 qImg extra-img\" src=\"https://scorekhel.com/storage/practiceQuestion/Que6054/eng/extra-image.jpg\" /><br> What is the difference between the total marks obtained by B and the total marks obtained by C?**%0D%0AA%29 20%0D%0AB%29 30%0D%0AC%29 25%0D%0AD%29 35 %0D%0AClick Link for Answer)
&nbsp;manufactured by two automobile companies A and B over the years from 2010 to 2015. The X-axis represents the years and the Y-axis represents number of vehicles in thousands.<br> (The data shown here is only for mathematical exercise. They do not represent the actual figures of the country.)<br><img class="img-fluid pr-2 py-1 qImg extra-img" src="https://scorekhel.com/storage/practiceQuestion/Que6066/eng/extra-image.jpg" /><br>Company B is projecting an increase in the number of vehicles to be manufactured in 2016 by 70% with respect to its average number of vehicles from 2010 to 2015. What should be the approximate percentage increase in the number of vehicles (in thousands) to be manufactured by Company A in 2016 with respect to the number of vehicles in 2015,&nbsp;so that it is at par with Company B?)
&nbsp;manufactured by two automobile companies A and B over the years from 2010 to 2015. The X-axis represents the years and the Y-axis represents number of vehicles in thousands.<br> (The data shown here is only for mathematical exercise. They do not represent the actual figures of the country.)<br><img class=\"img-fluid pr-2 py-1 qImg extra-img\" src=\"https://scorekhel.com/storage/practiceQuestion/Que6066/eng/extra-image.jpg\" /><br>Company B is projecting an increase in the number of vehicles to be manufactured in 2016 by 70% with respect to its average number of vehicles from 2010 to 2015. What should be the approximate percentage increase in the number of vehicles (in thousands) to be manufactured by Company A in 2016 with respect to the number of vehicles in 2015,&nbsp;so that it is at par with Company B?**%0D%0AA%29 45%0D%0AB%29 42%0D%0AC%29 57%0D%0AD%29 50 %0D%0AClick Link for Answer)
 of the number of computers sold by a shopkeeper during five months.<br><img class="img-fluid pr-2 py-1 qImg extra-img" src="https://scorekhel.com/storage/practiceQuestion/Que6141/eng/extra-image.jpg" /><br>By what percentage is the total number of computers sold in February and March more than the number of computers sold in April and May (correct to one decimal place)?)
 of the number of computers sold by a shopkeeper during five months.<br><img class=\"img-fluid pr-2 py-1 qImg extra-img\" src=\"https://scorekhel.com/storage/practiceQuestion/Que6141/eng/extra-image.jpg\" /><br>By what percentage is the total number of computers sold in February and March more than the number of computers sold in April and May (correct to one decimal place)?**%0D%0AA%29 11.5%%0D%0AB%29 9.9%%0D%0AC%29 10.6%%0D%0AD%29 8.8% %0D%0AClick Link for Answer)
70