SSC CPO 2020 objective Ques (54 results)
SSC CPO 202011)The given histogram shows the frequency distribution of the speed of cars passing though at a particular spot on a highway. Study the graph and answer the question that follows.
The number of cars with speed between 70 km/h and 80 km/h is what percentage more than the number of the cars with speed between 50 km/h and 60 km/h? (correct to one decimal place)
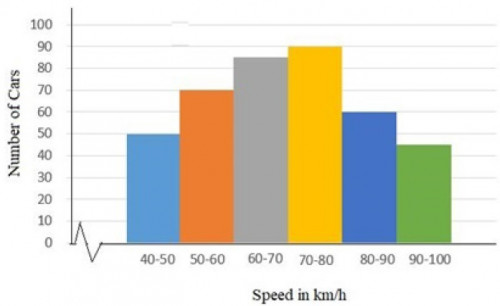
28.6%
SSC CPO 202012)The given pie chart shows the percentage distribution of 450 employees in an organisation. Study the pie chart and answer the question that follows.
What is the central angel of the sector representing the number of employees in department A?
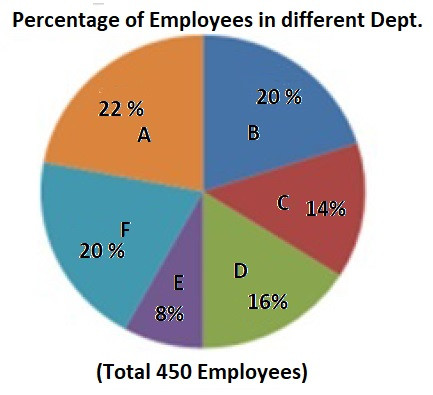
72°
SSC CPO 202013)The given bar graph represents the number of boys and girls in five different schools. Study the graph and answer the question that follows..
What is the ratio of girls and boys from all the schools taken together?
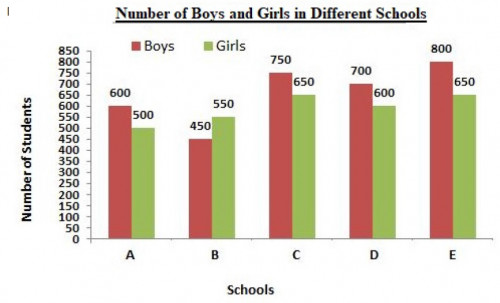
59 : 66
SSC CPO 202014)The given histogram shows the frequency distribution of the speed of cars passing though at a particular spot on a highway. Study the graph and answer the question that follows.
What is the ratio of the number of cars with speed less than 60 km/h to the number of cars with speed more than 80 km/h?
8 : 7
SSC CPO 202015)The given pie chart shows the percentage distribution of 450 employees in an organisation. Study the pie chart and answer the question that follows.
If 60% of the employees in department E are females, how many male employees are there in that department?
36
SSC CPO 202016)The given pie chart shows the percentage distribution of 450 employees in an organisation. Study the pie chart and answer the question that follows.
What is the number of employees working in department B?
63
SSC CPO 202017)The given histogram shows the frequency distribution of the speed of cars passing through at a particular spot on a highway. Study the graph and answer the question that follows.
What percentage of cars were running with a speed of less than or equal to 70 km/h?
51.25%
SSC CPO 202018)The given bar graph represents the number of boys and girls in five different schools. Study the graph and answer the question that follows
In which school is the percentage of girls the lowest?
E
SSC CPO 202019)The given bar graph represents the number of boys and girls in five different schools. Read the graph and answer the question that follows.
What is the average number of students (girls and boys) in schools A, B, C, D and E?
)
**%0D%0AA%29 29.7%%0D%0AB%29 15.5%%0D%0AC%29 22.2%%0D%0AD%29 28.6% %0D%0AClick Link for Answer)
 in schools A, B, C, D and E?)
 in schools A, B, C, D and E?**%0D%0AA%29 596%0D%0AB%29 1250%0D%0AC%29 625%0D%0AD%29 660 %0D%0AClick Link for Answer)
1250
SSC CPO 202020)The given bar graph represents the number of boys and girls in five different schools. read the graph and answer the question that follows.
What is the ratio of the girls from schools A, B and C taken together to the boys from all schools taken together?
17 : 33