SSC CHSL 2021 objective Ques (143 results)
SSC CHSL 202171)The following histogram represents the daily earnings of 50 medical stores in a locality.
The difference between the percentage of medical stores whose daily earnings are less than Rs. 1,000 and the percentage of medical stores whose daily earnings are Rs. 1,200 and above is:
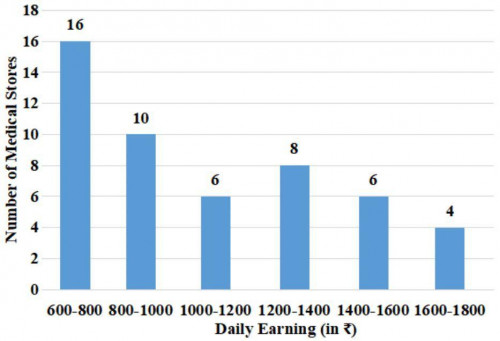
16%
SSC CHSL 202172)The pie chart shows the money spent by Aditya through credit cards of different banks. The total money spent by him through credit cards in a year is Rs. 3,60,000.
How much more money was spent through Card C as compared to Card D?
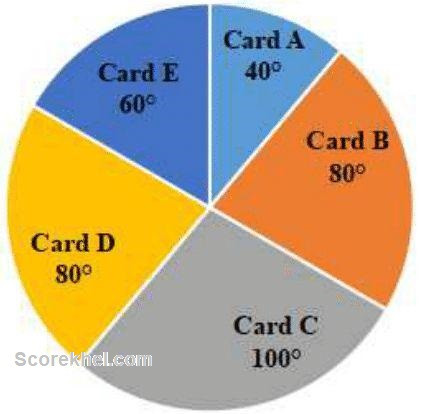
Rs. 20,000
SSC CHSL 202173)Study the given graph and answer the question that follows.
The total revenue of the company in 2014, 2016, and 2018 is what percentage of the total expenditure in 2015 to 2017 and 2019 (correct to one decimal place)?
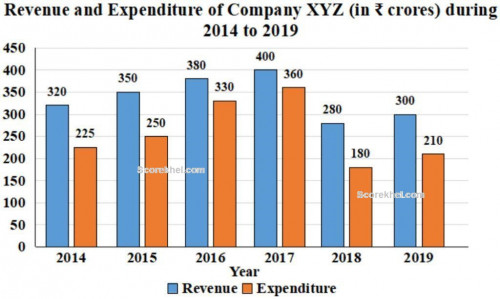
85.2%
SSC CHSL 202174)Study the given graph which shows the number of workers with their wages and answer the question that follows.
What is the ratio of the total number of workers whose daily wages are Rs. 450 or above but less than Rs. 500 to the total number of workers whose daily wages are Rs. 650 or above?
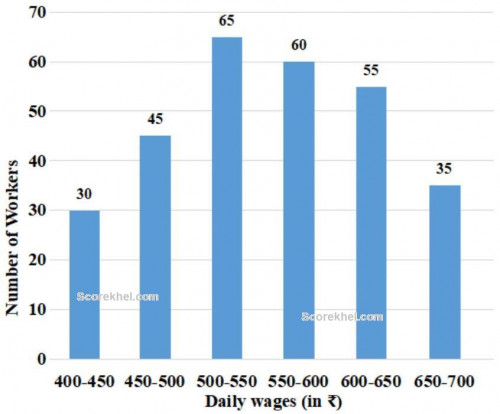
9 ∶ 7
SSC CHSL 202175)Study the given pie-charts and answer the question that follows.
The pie charts represent the popularity of ice-cream flavors among families in the years 2019 and 2020.
If 1% increase resulted in annual additional sales of Rs. 10,000, then how much (in Rs.), did the combined strawberry, other and Butterscotch sales increase from 2019 to 2020?
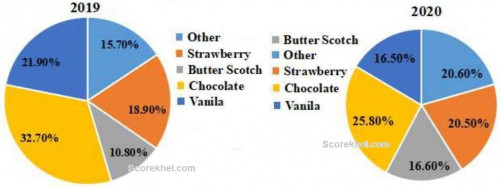
1,23,000
SSC CHSL 202176)Study the given graph which shows the Target and Actual production of ACs' (in thousands) of a factory over five months and answer the question that follows.
The ratio of the combined target production of ACs from January to April to that of the actual production of ACs from March to May is:
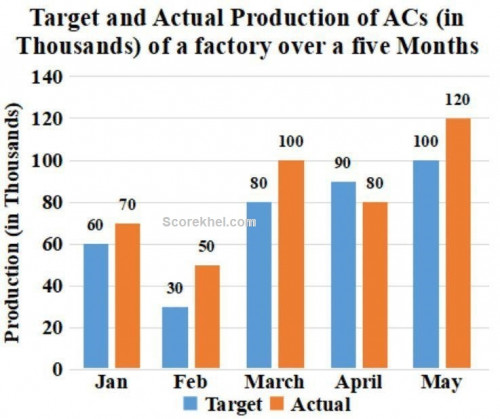
13 : 15
SSC CHSL 202177)Study the graph which shows daily wages (in Rs.) with a number of workers and answer the question that follows.
If the ratio of the total number of workers whose daily wages are less than Rs. 450 to the total number of workers whose daily wages are Rs. 600 or above is a : b, then what is the difference between b and a?
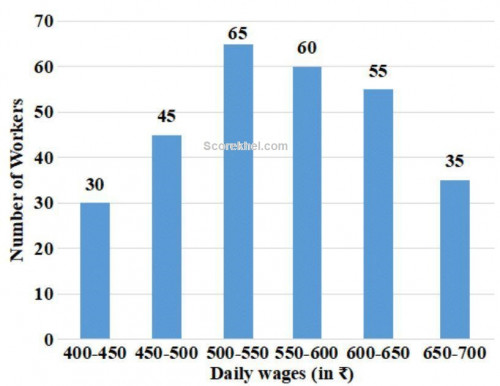
2
SSC CHSL 202178)Study the following graph and answer the question that follows.
Marks scored by five students A, B, C, D and E in three subjects (Maths, English and Physics)
What are the approximate average marks obtained by C?
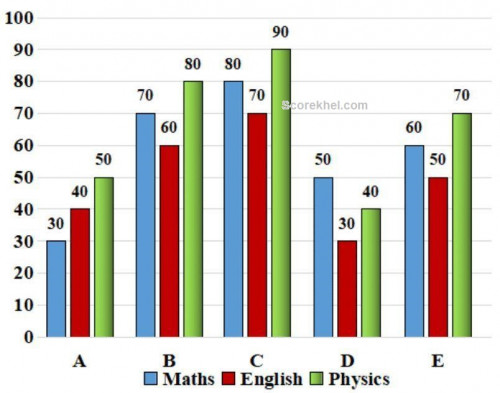
80
SSC CHSL 202179)Study the given graph and answer the question that follows.
In which month is the actual production of ACs 20% more than its target production?
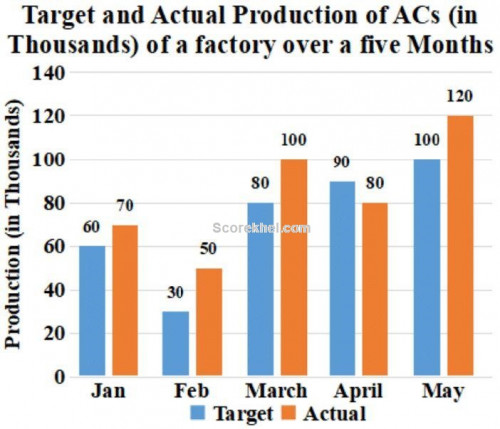
May
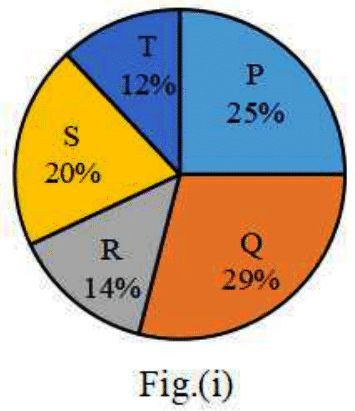
80)The given pie charts show the distribution of students of graduate and postgraduate levels in five different institutes, P, Q, R, S, and T, in a town. Study the pie charts and answer the question that follows.
(i) Total number of students of graduate-level in five different institutes = 12400
(ii) Total number of students of postgraduate level in five different institutes = 8000
The total number of graduate and postgraduate level students in institute Q is:SSC CHSL 2021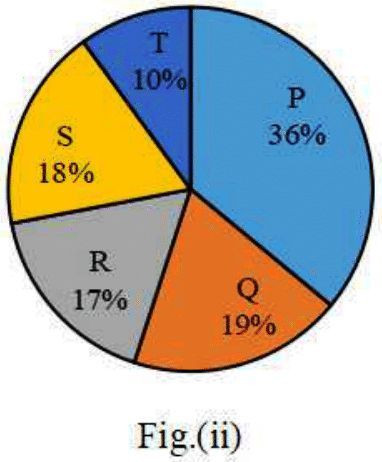
?)
?**%0D%0AA%29 81.6%%0D%0AB%29 83.4%%0D%0AC%29 84.3%%0D%0AD%29 85.2% %0D%0AClick Link for Answer)
, did the combined strawberry, other and Butterscotch sales increase from 2019 to 2020?)
, did the combined strawberry, other and Butterscotch sales increase from 2019 to 2020?**%0D%0AA%29 1,23,000%0D%0AB%29 1,32,000%0D%0AC%29 2,13,000%0D%0AD%29 3,12,000 %0D%0AClick Link for Answer)
 of a factory over five months and answer the question that follows.<br><img class="img-fluid pr-2 py-1 qImg extra-img" src="https://scorekhel.com/storage/practiceQuestion/Que5735/eng/extra-image.jpg" /><br>The ratio of the combined target production of ACs from January to April to that of the actual production of ACs from March to May is:)
 of a factory over five months and answer the question that follows.<br><img class=\"img-fluid pr-2 py-1 qImg extra-img\" src=\"https://scorekhel.com/storage/practiceQuestion/Que5735/eng/extra-image.jpg\" /><br>The ratio of the combined target production of ACs from January to April to that of the actual production of ACs from March to May is:**%0D%0AA%29 19 : 15%0D%0AB%29 15 : 13%0D%0AC%29 15 : 19%0D%0AD%29 13 : 15 %0D%0AClick Link for Answer)
 with a number of workers and answer the question that follows.<br><img class="img-fluid pr-2 py-1 qImg extra-img" src="https://scorekhel.com/storage/practiceQuestion/Que5736/eng/extra-image.jpg" /><br>If the ratio of the total number of workers whose daily wages are less than Rs. 450 to the total number of workers whose daily wages are Rs. 600 or above is a : b, then what is the difference between b and a?)
 with a number of workers and answer the question that follows.<br><img class=\"img-fluid pr-2 py-1 qImg extra-img\" src=\"https://scorekhel.com/storage/practiceQuestion/Que5736/eng/extra-image.jpg\" /><br>If the ratio of the total number of workers whose daily wages are less than Rs. 450 to the total number of workers whose daily wages are Rs. 600 or above is a : b, then what is the difference between b and a?**%0D%0AA%29 2%0D%0AB%29 3%0D%0AC%29 0%0D%0AD%29 1 %0D%0AClick Link for Answer)
<br><img class="img-fluid pr-2 py-1 qImg extra-img" src="https://scorekhel.com/storage/practiceQuestion/Que5744/eng/extra-image.jpg" /><br>What are the approximate average marks obtained by C?)
<br><img class=\"img-fluid pr-2 py-1 qImg extra-img\" src=\"https://scorekhel.com/storage/practiceQuestion/Que5744/eng/extra-image.jpg\" /><br>What are the approximate average marks obtained by C?**%0D%0AA%29 80%0D%0AB%29 65%0D%0AC%29 70%0D%0AD%29 75 %0D%0AClick Link for Answer)
 Total number of students of graduate-level in five different institutes = 12400<br><img class="img-fluid pr-2 py-1 qImg extra-img" src="https://scorekhel.com/storage/practiceQuestion/Que5834/eng/extra-image.jpg" /><br>(ii) Total number of students of postgraduate level in five different institutes = 8000<br>The total number of graduate and postgraduate level students in institute Q is:)
 Total number of students of graduate-level in five different institutes = 12400<br><img class=\"img-fluid pr-2 py-1 qImg extra-img\" src=\"https://scorekhel.com/storage/practiceQuestion/Que5834/eng/extra-image.jpg\" /><br>(ii) Total number of students of postgraduate level in five different institutes = 8000<br>The total number of graduate and postgraduate level students in institute Q is:**%0D%0AA%29 5116%0D%0AB%29 4116%0D%0AC%29 5126%0D%0AD%29 5216 %0D%0AClick Link for Answer)
5116