SSC CHSL 2021 objective Ques (143 results)
SSC CHSL 202161)Study the given pie-chart and answer the question that follows.
The pie-chart represents the consumption of fuel (in million litres) by various modes of transport of a country X in the year 2015. The total consumption of fuel by various modes of transport of the country is 800 million litres. (The data shown here is only for mathematical exercise. They do not represent the actual figures of the country.)
To obtain fuel, energy is required to run the machinery. which is to be produced by burning coal.
If 1 tonne of coal is burnt to produce 0.4 million litres of oil, then approximately what is the requirement of coal (in tonnes) for the Trains sector?
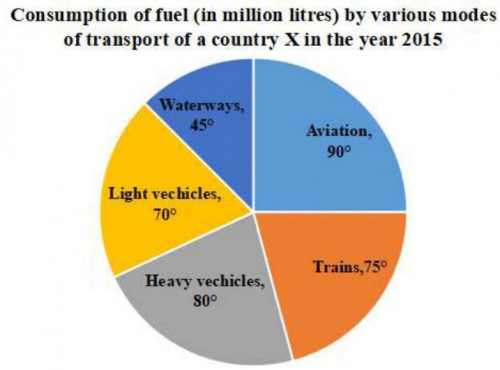
417
SSC CHSL 202162)The following histogram represents the distribution of household expenditure (in Rs.) of 200 manual workers in a city.
The ratio of the number of workers whose household expenditure is less than Rs. 200 to the number of workers whose household expenditure is Rs. 300 and above is:
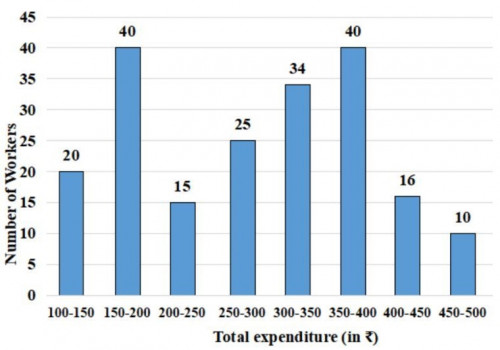
3 : 5
SSC CHSL 202163)Study the given graph and answer the question that follows.
The average production of paper by company B in 2014, 2017 and 2018 was \(13 \frac{1}{4}\) % less than the production of paper by company A in the year:
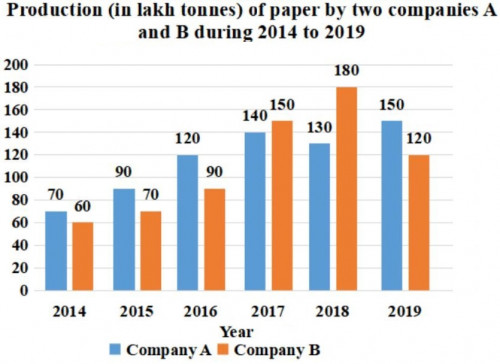
2019
64)The number of students enrolled in different streams at Senior Secondary level in five schools has been shown in the bar graph.
What is the ratio of the number of students enrolled in the vocational stream in schools A, C and E taken together to those enrolled in the humanities stream in the schools B, D and E taken together?SSC CHSL 2021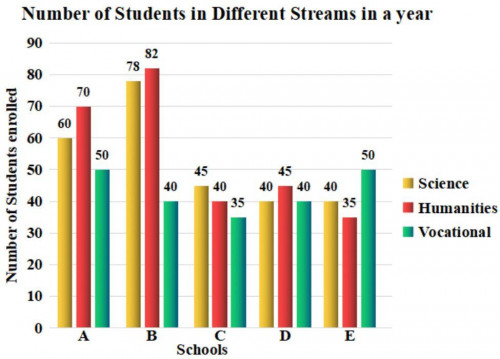
5 : 6
SSC CHSL 202165)Study the given pie chart and answer the question that follows.
The pie chart shows the distribution (degree-wise) of the number of computers sold by a shopkeeper during five months.
In which month was the number of computers sold above 25% of the total number of computers sold in 5 months?
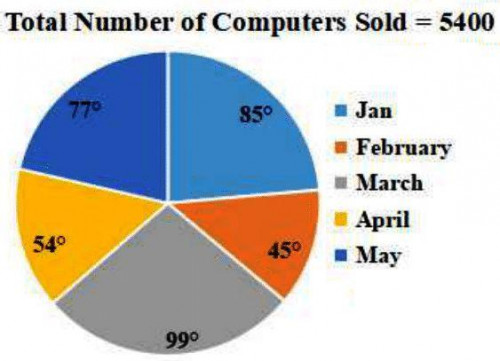
March
SSC CHSL 202166)Study the following graph and answer the question that follows.
Marks scored by five students (A, B, C, D and E) in three subjects (Maths, English and Physics)
What is the ratio of the marks of D’s in Maths and Physics together to the marks of B's in English and Physics ?
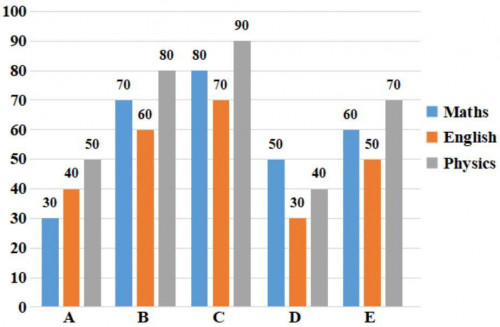
9 : 14
67)Study the given pie charts and answer the question that follows.
The pie charts represent the distribution of candidates who were enrolled for Bank Clerical Examination Fig (i) and the candidates (out of those enrolled) who passed the examination Fig (ii) in five different institutes P, Q, R. S and T.
(I) Total number of candidates enrolled in five different institutes = 5500
(II) Total number of candidates who passed the examination from five institutes = 3300
The ratio of the candidates who passed to the candidates enrolled from institute S is:SSC CHSL 2021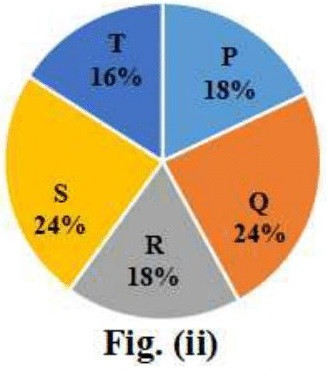
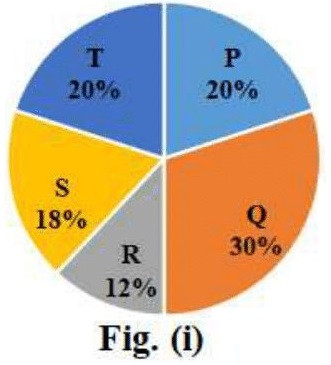
4 : 5
SSC CHSL 202168)Study the given graph and answer the question that follows.
By what percentage is the total exports in 2014 and 2016 less than the total imports in the same two years?
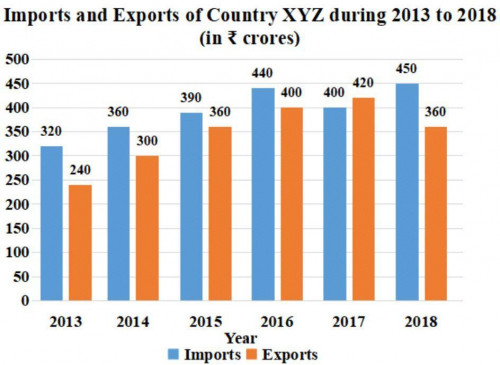
12.5
SSC CHSL 202169)Study the given graph and answer the question that follows.
What is the ratio of the total production of paper by company A in 2016 and 2019 to the total production of paper by company B in 2014 and 2017?
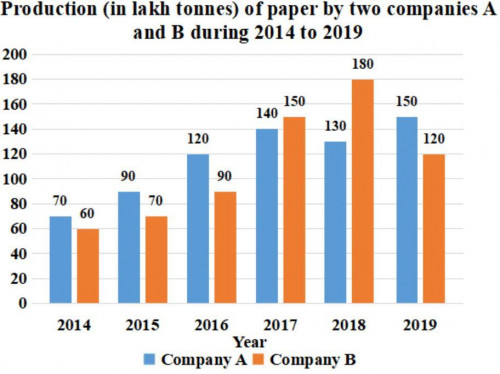
9 : 7
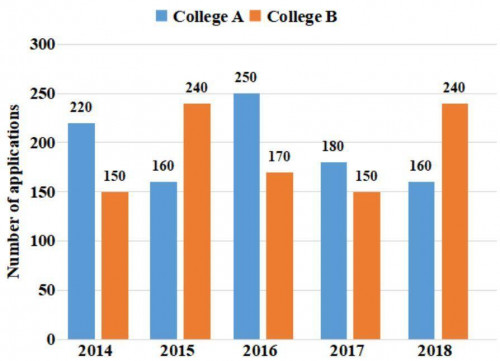
SSC CHSL 202170)Study the following bar graph and answer the question given below.
The bar graph represents the total number of applications received for B.Sc. Mathematics by two different colleges A and B in 5 different years.
Find the difference between the average number of applications received by college A from 2014 to 2018 and the average number of applications received by college B from 2014 to 2018?
 by various modes of transport of a country X in the year 2015. The total consumption of fuel by various modes of transport of the country is 800 million litres. (The data shown here is only for mathematical exercise. They do not represent the actual figures of the country.)<br> <br><img class="img-fluid pr-2 py-1 qImg extra-img" src="https://scorekhel.com/storage/practiceQuestion/Que5335/eng/extra-image.jpg" /><br><br> To obtain fuel, energy is required to run the machinery. which is to be produced by burning coal.<br> If 1 tonne of coal is burnt to produce 0.4 million litres of oil, then approximately what is the requirement of coal (in tonnes) for the Trains sector?)
 by various modes of transport of a country X in the year 2015. The total consumption of fuel by various modes of transport of the country is 800 million litres. (The data shown here is only for mathematical exercise. They do not represent the actual figures of the country.)<br> <br><img class=\"img-fluid pr-2 py-1 qImg extra-img\" src=\"https://scorekhel.com/storage/practiceQuestion/Que5335/eng/extra-image.jpg\" /><br><br> To obtain fuel, energy is required to run the machinery. which is to be produced by burning coal.<br> If 1 tonne of coal is burnt to produce 0.4 million litres of oil, then approximately what is the requirement of coal (in tonnes) for the Trains sector?**%0D%0AA%29 417%0D%0AB%29 415%0D%0AC%29 420%0D%0AD%29 418 %0D%0AClick Link for Answer)
 of 200 manual workers in a city.<br> <br><img class="img-fluid pr-2 py-1 qImg extra-img" src="https://scorekhel.com/storage/practiceQuestion/Que5336/eng/extra-image.jpg" /><br><br> The ratio of the number of workers whose household expenditure is less than Rs. 200 to the number of workers whose household expenditure is Rs. 300 and above is:)
 of 200 manual workers in a city.<br> <br><img class=\"img-fluid pr-2 py-1 qImg extra-img\" src=\"https://scorekhel.com/storage/practiceQuestion/Que5336/eng/extra-image.jpg\" /><br><br> The ratio of the number of workers whose household expenditure is less than Rs. 200 to the number of workers whose household expenditure is Rs. 300 and above is:**%0D%0AA%29 4 : 5%0D%0AB%29 3 : 4%0D%0AC%29 2 : 5%0D%0AD%29 3 : 5 %0D%0AClick Link for Answer)
 % less than the production of paper by company A in the year:)
 of the number of computers sold by a shopkeeper during five months.<br><img class="img-fluid pr-2 py-1 qImg extra-img" src="https://scorekhel.com/storage/practiceQuestion/Que5439/eng/extra-image.jpg" /><br>In which month was the number of computers sold above 25% of the total number of computers sold in 5 months?)
 of the number of computers sold by a shopkeeper during five months.<br><img class=\"img-fluid pr-2 py-1 qImg extra-img\" src=\"https://scorekhel.com/storage/practiceQuestion/Que5439/eng/extra-image.jpg\" /><br>In which month was the number of computers sold above 25% of the total number of computers sold in 5 months?**%0D%0AA%29 May%0D%0AB%29 March%0D%0AC%29 January%0D%0AD%29 February %0D%0AClick Link for Answer)
 in three subjects (Maths, English and Physics)<br><img class="img-fluid pr-2 py-1 qImg extra-img" src="https://scorekhel.com/storage/practiceQuestion/Que5440/eng/extra-image.jpg" /><br>What is the ratio of the marks of D’s in Maths and Physics together to the marks of B's in English and Physics ?)
 in three subjects (Maths, English and Physics)<br><img class=\"img-fluid pr-2 py-1 qImg extra-img\" src=\"https://scorekhel.com/storage/practiceQuestion/Que5440/eng/extra-image.jpg\" /><br>What is the ratio of the marks of Ds in Maths and Physics together to the marks of Bs in English and Physics ?**%0D%0AA%29 9 : 14%0D%0AB%29 14 : 13%0D%0AC%29 7 : 14%0D%0AD%29 2 : 7 %0D%0AClick Link for Answer)
 and the candidates (out of those enrolled) who passed the examination Fig (ii) in five different institutes P, Q, R. S and T.<br> (I) Total number of candidates enrolled in five different institutes = 5500<br><img class="img-fluid pr-2 py-1 qImg extra-img" src="https://scorekhel.com/storage/practiceQuestion/Que5442/eng/extra-image.jpg" /><br> (II) Total number of candidates who passed the examination from five institutes = 3300<br>The ratio of the candidates who passed to the candidates enrolled from institute S is:)
 and the candidates (out of those enrolled) who passed the examination Fig (ii) in five different institutes P, Q, R. S and T.<br> (I) Total number of candidates enrolled in five different institutes = 5500<br><img class=\"img-fluid pr-2 py-1 qImg extra-img\" src=\"https://scorekhel.com/storage/practiceQuestion/Que5442/eng/extra-image.jpg\" /><br> (II) Total number of candidates who passed the examination from five institutes = 3300<br>The ratio of the candidates who passed to the candidates enrolled from institute S is:**%0D%0AA%29 3 : 4%0D%0AB%29 5 : 6%0D%0AC%29 6 : 7%0D%0AD%29 4 : 5 %0D%0AClick Link for Answer)
4