SSC CHSL 2021 objective Ques (143 results)
51)Study the given graph and answer the question that follows.
What is the ratio of the total revenue of the company in 2015 and 2018 to the total expenditure in 2017 and 2018?SSC CHSL 2021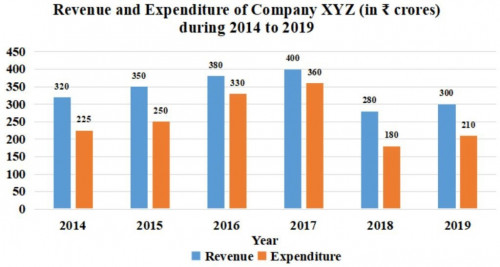
7 ∶ 6
52)Study the following bar graph and answer the question that follows.
The average export of diamonds for the given period (in Rs.crores) was:SSC CHSL 2021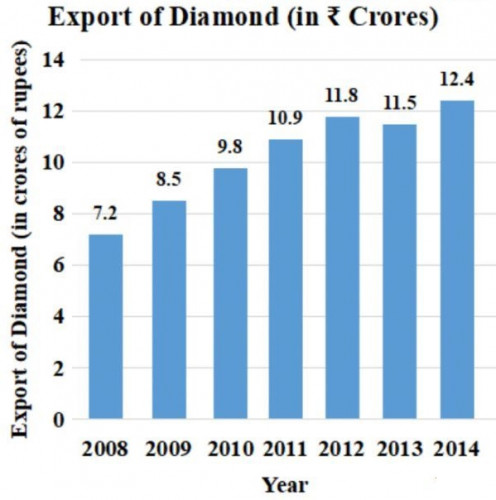
10.3
53)Study the given graph and answer the question the follows.
In 2019, if the production of vehicle of type A increased by the same percentage as that in 2018, over its previous year, then what was the number (in thousands) of vehicle of type A produced in 2019?SSC CHSL 2021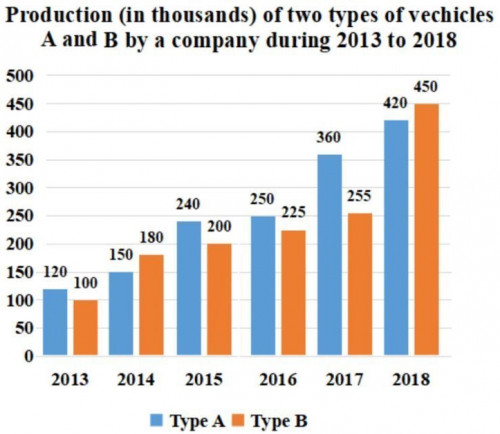
490
54)Study the given graph which shows the target and actual production of ACs (in thousands) of a factory over five months and answer the question that follows:
The actual production of ACs in February is what percent less than the average target production of ACs over the period of five months (correct to the nearest integer)?SSC CHSL 2021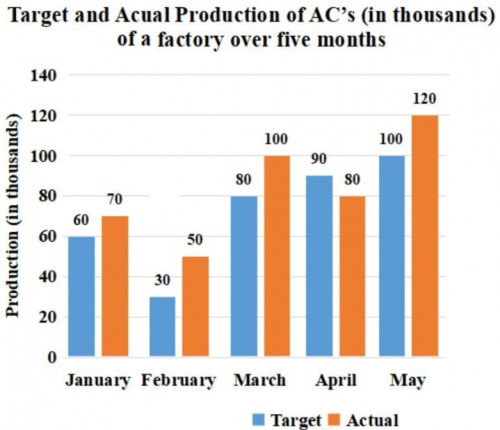
31%
55)Study the given graph and answer the question that follows.
What is the ratio of the total number of vehicles of type A produced in 2015 and 2017 to the total number of vehicles of type B produced in 2016 and 2017?SSC CHSL 2021
5 ∶ 4
SSC CHSL 202156)The given line graph shows the production (in tonnes) and the sales (in tonnes) of a company.
What is the difference (in tonnes) in the production in 2015 and 2017 taken together and the sales in 2018 and 2019 taken together?
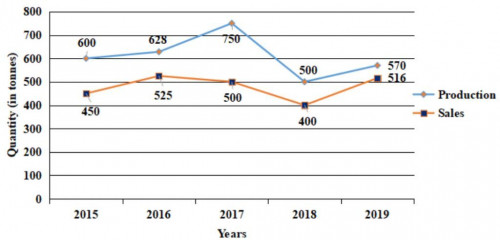
434
SSC CHSL 202157)Study the given bar graph and answer the question that follows.
The bar graph shows the production of table fans in a factory for one week.
The ratio of the total production of table fans on Tuesday and Wednesday together to that on Thursday and Friday together is:
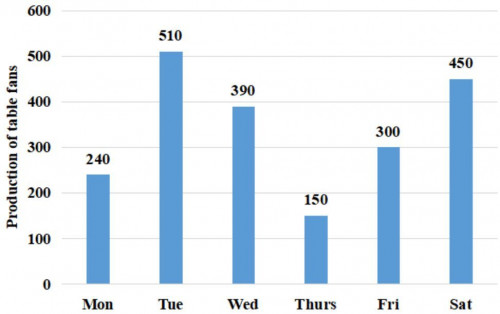
2 ∶ 1
SSC CHSL 202158)The given bar graph indicates the production of sugar (in lakh tonnes) by three different sugar companies P, Q and R from the year 2015 to 2019. Study the bar graph and answer the question that follows.
Production of sugar by companies P, Q and R from 2015 to 2019
The ratio of the average production of sugar by company P from the year 2015 to 2019 to the average production of sugar by company R from the year 2015 to 2019 is:
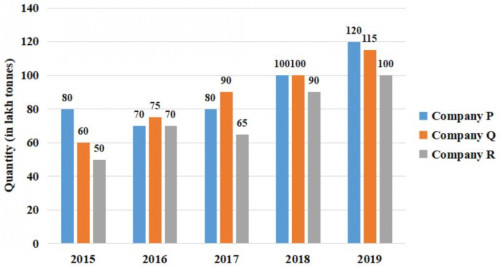
6 ∶ 5
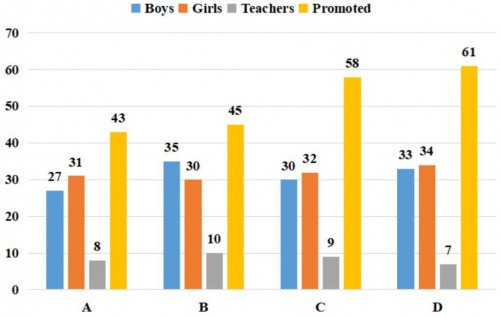
SSC CHSL 202159)The given bar graph shows the number of boys and girls in classes A, B, C, and D in a school, the number of teachers allotted to each class, and the number of students promoted to the next class.
Which class has the highest percentage of failed students?
 and the sales (in tonnes) of a company.<br><img class="img-fluid pr-2 py-1 qImg extra-img" src="https://scorekhel.com/storage/practiceQuestion/Que5224/eng/extra-image.jpg" /><br> What is the difference (in tonnes) in the production in 2015 and 2017 taken together and the sales in 2018 and 2019 taken together?)
 and the sales (in tonnes) of a company.<br><img class=\"img-fluid pr-2 py-1 qImg extra-img\" src=\"https://scorekhel.com/storage/practiceQuestion/Que5224/eng/extra-image.jpg\" /><br> What is the difference (in tonnes) in the production in 2015 and 2017 taken together and the sales in 2018 and 2019 taken together?**%0D%0AA%29 309%0D%0AB%29 462%0D%0AC%29 334%0D%0AD%29 434 %0D%0AClick Link for Answer)
 by three different sugar companies P, Q and R from the year 2015 to 2019. Study the bar graph and answer the question that follows.<br> Production of sugar by companies P, Q and R from 2015 to 2019<br><img class="img-fluid pr-2 py-1 qImg extra-img" src="https://scorekhel.com/storage/practiceQuestion/Que5243/eng/extra-image.jpg" /><br>The ratio of the average production of sugar by company P from the year 2015 to 2019 to the average production of sugar by company R from the year 2015 to 2019 is:)
 by three different sugar companies P, Q and R from the year 2015 to 2019. Study the bar graph and answer the question that follows.<br> Production of sugar by companies P, Q and R from 2015 to 2019<br><img class=\"img-fluid pr-2 py-1 qImg extra-img\" src=\"https://scorekhel.com/storage/practiceQuestion/Que5243/eng/extra-image.jpg\" /><br>The ratio of the average production of sugar by company P from the year 2015 to 2019 to the average production of sugar by company R from the year 2015 to 2019 is:**%0D%0AA%29 8&nbsp;∶ 5%0D%0AB%29 7&nbsp;∶ 5%0D%0AC%29 6&nbsp;∶ 5%0D%0AD%29 7&nbsp;∶ 6 %0D%0AClick Link for Answer)
B
60)Students of Primary, Middle, Secondary and Sr. Secondary classes collected donation for a Relief Fund as shown in the pie chart. If the donation collected from Middle classes was Rs. 6,750, then how much money was collected by the Primary classes?
SSC CHSL 2021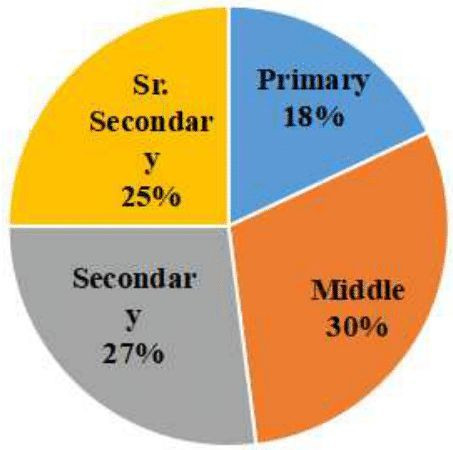
Rs. 4,050