SSC CHSL 2021 objective Ques (143 results)
31)The given pie charts show the distribution of students of graduate and postgraduate levels in five different instututes P, Q, R, S and T in a town. Study the pie charts and answer the question that follows.
The number of students in graduate level in institute S is appriximately what percentage more than the number of students in post graduate level in institute S (correct to one decimal place).SSC CHSL 2021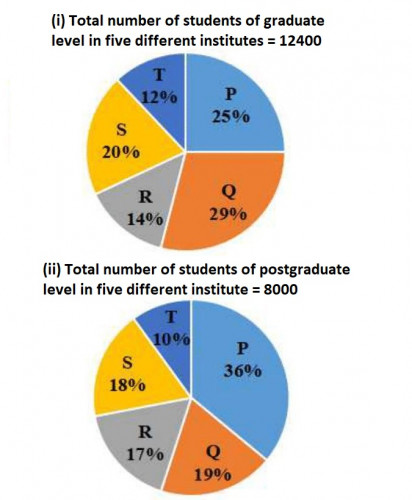
72.2%
32)Study the line graph and answer the question that follows
The line graph reprensents the number of vehicles (in thousands) manufactured by two automobile companies A and B over the years from 2010. The X -axis represents the years and Y -axis represents of vehicles in thousands.
(The data shown here is only for mathematical exercise. They do not represent the actual figures of the country)
If there was an increase of 24% in the average number of vehicles (in thousands) manufactured by company B during 2011 to 2014) with respect to number of vehicles manufacured by company A in 2009. then how many vehicles (in thousands) did company A manufacture in 2009?SSC CHSL 2021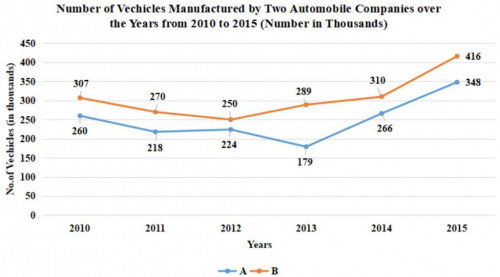
225.6
33)Direction: Study the given bar graphs and answer the question that follows.
The bar graphs represent the amount invested in raw materials(in ₹ crore) and the sale of the products, by a textile company in the years 2007— 2012. The X-axis represents the years. The Y-axis represents the amount invested in raw materials (in ₹ crore) in figure 1 and sale of products in figure 2, respectively.
The sum of the amounts invested during the years 2007, 2008 and 2010 is what percentage (correct to one decimal place) of the sum of the sales of products during 2009 and 2011?SSC CHSL 2021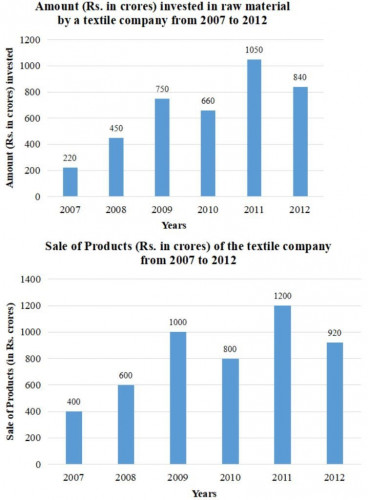
60.5
34)The pie chart shows the money spent by Aditya through credit cards of different banks. The total money spent by him through the credit cards in a year is ₹3,60,000.
What is the maximum amount spent by Aditya through the credit card of one bank ?SSC CHSL 2021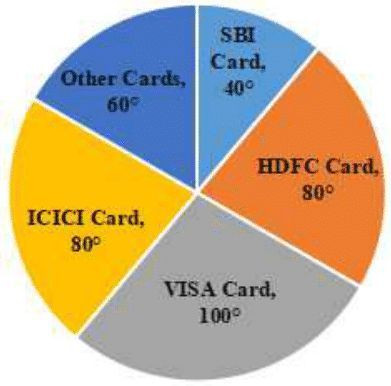
1,00,000
35)Study the given bar graph and answer the question that follows.
A soft drink company prepares drinks of three different flavours A, B and C. The bar graph shows the production of three flavours over a period of five years from 2010 to 2014.
For which of the following years, is the percentage of the rise in production compared to its previous year the maximum with respect to flavour C?SSC CHSL 2021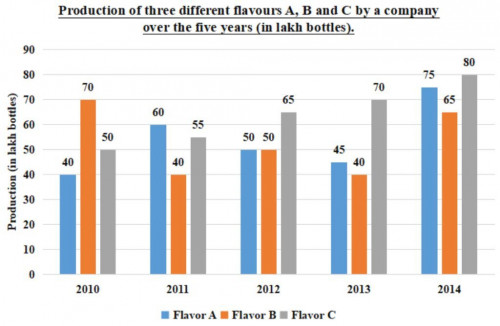
2012
36)Study the given bar graph and answer the question that follows.
In how many of the given years was the production of organic fertilizers more than the average production of organic fertilizers in the given years?SSC CHSL 2021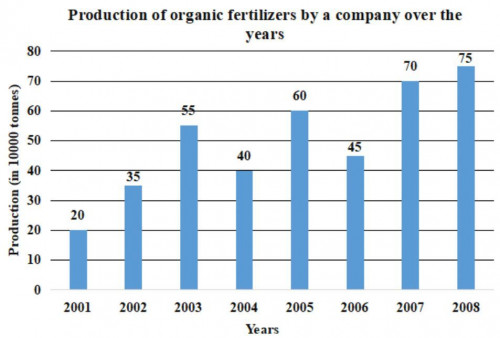
4
37)Study the line graph and answer the question that follows.
The line graph represents the number of vehicles (in thousands) manufactured by two automobile companies A and B over the years from 2010 to 2015. The X-axis represents the years and the Y-axis represents number of vehicles in thousands.
(The data shown here is only for mathematical exercise. They do not represent the actual figures of the country.)
The average value of the vehicles manufactured by Company A is what per cent of the average value of the vehicles manufactured by Company B during 2010 to 2015?SSC CHSL 2021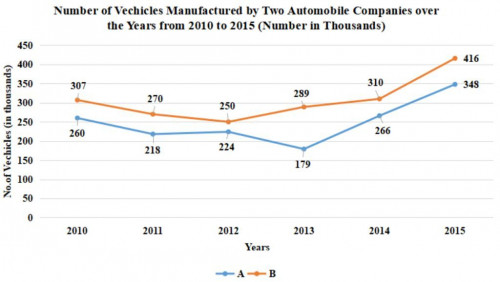
81.2
38)Study the given pie-chart and answer the question that follows.
The pie-chart represents the consumption of fuel (in million litres) by various modes of transport of a country X in the year 2015. The total consumption of fuel by various modes of transport of the country is 800 million litres.
(The data shown here is only for mathematical exercise. They do not represent the actual figures of the country.)
The fuel consumed by light vehicles is approximately what percentage of the combined consumption of fuel for aviation and waterways?SSC CHSL 2021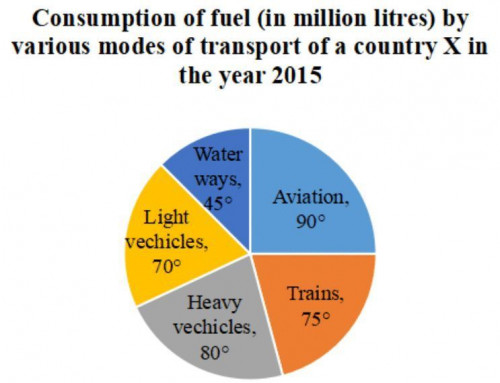
52
39)Study the given bar graph and answer the question that follows.
A tea plantation company produces three varieties of tea - black tea, green tea and herbal tea. The production of three varieties (in million tonnes) over a period of six years from 2014 to 2019, has been shown in the bar graph here. The X-axis represents the years and the Y-axis displays the production of the three varieties in million tonnes.
The average value of the combined production of black tea and herbal tea from 2014 to 2019 is what percent (up to 1 decimal place) of the average value of the production of green tea during the same period?SSC CHSL 2021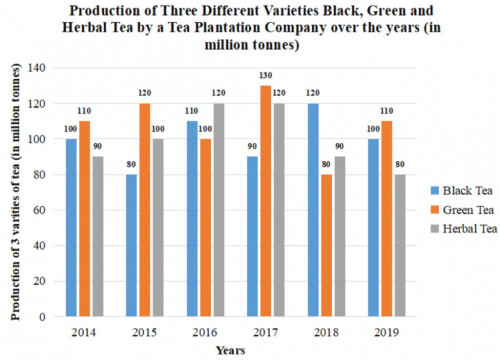
92.3
40)The given bar graph shows the production of table fans in a factory during one week. Study the bar graph and answer the question that follows.
The production of fans on Tuesday is what percentage of the total production of fans during the week?SSC CHSL 2021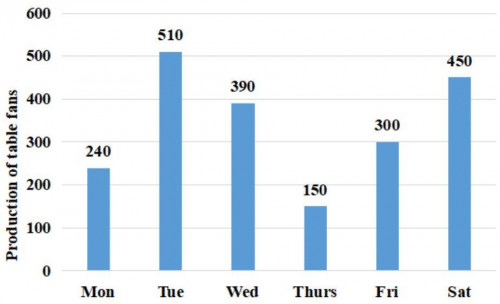
25%