SSC CHSL 2021 objective Ques (143 results)
21)The given pie chart shows the distribution of money spent by Aditya through credit cards of different banks A, B, C, D and E. The total money spent by him through credit cards in a year is Rs.3,60,000.
What is his combined spending through credit cards of bank A and bank C?SSC CHSL 2021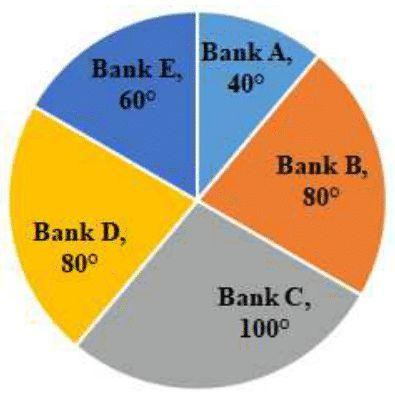
Rs. 1,40,000
22)Study the given table & pie chart and answer the question that follows.
The table shows the number of boys of class X in six different sections A, B, C, D, E and F.
The pie chart represents the percentage-wise distribution of 300 students of class X in a school in six different sections A, B. C, D, E and F.
Section
A
B
C
D
E
F
No. of boys
36
26
34
28
-
20
The difference between the central angles of the sectors corresponding to the sections A and F is:
SSC CHSL 2021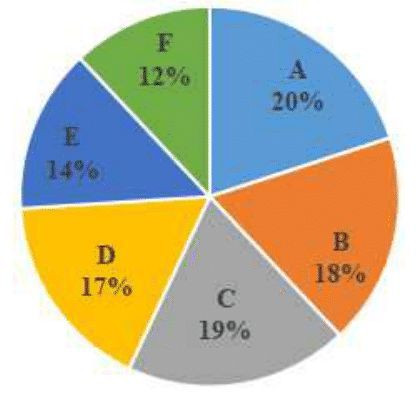
28.8°
23)The given histogram shows the marks scored by 40 students in a test of maximum 30 marks.
What is the percentage of students who scored less than 50% marks ?SSC CHSL 2021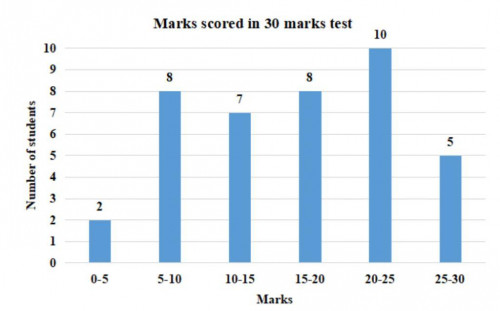
42.5
24)Study the given pie charts and answer the question that follows.
The pie charts show the distribution of students of graduate and postgraduate levels in five different institutes P, Q, R, S and T in a town.
The ratio of the number of students of graduate level in Institutes P and S together to that of postgraduate level hi institutes P and S is:SSC CHSL 2021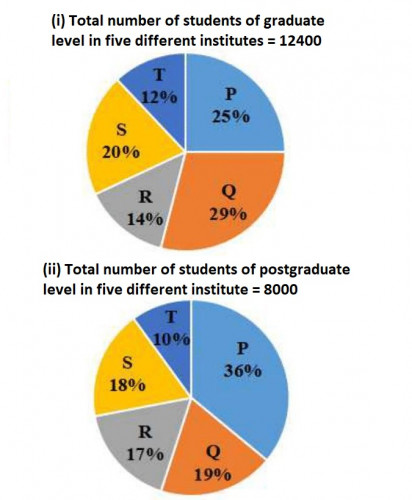
31 : 24
25)Study the given pie chart and answer the question that follows.
The pie chart represents the popularity of ice-cream flavors among families in the year 2019.
In 2019, if 20% of the 'Other' category was Anjeer flavor and 4082 people preferred Anjeer flavor, then how many people were surveyed?SSC CHSL 2021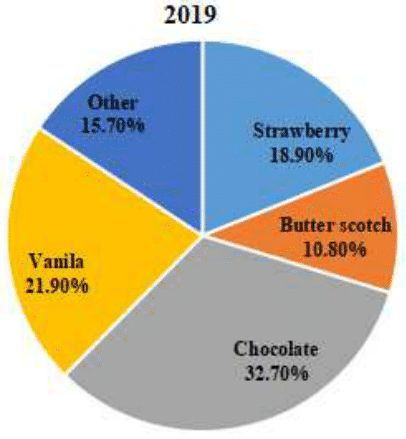
1,30,000
26)Study the graph given below and answer the question that follows.
The given chart represents the demand and production of leather bags of five companies U, V, X, Y and Z.
If the production of leather bags by company Y is equal to 'm' times of the production of leather bags by company X, then the value of 'm' is:SSC CHSL 2021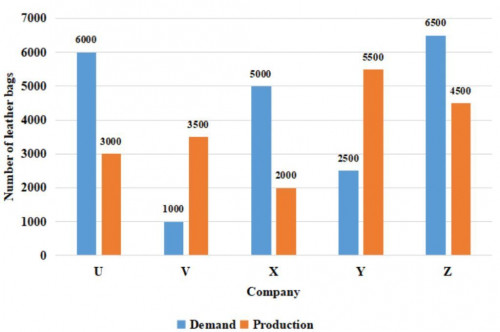
2.75
27)Study the given pie-chart and answer the question that follows.
The pie-chart represents the percentage distribution of candidates qualified in a bank examination from six different districts of a State in 2016. The total number of qualified candidates from the State is 68000.
Out of the total selected candidates from Districts B and D, rural candidates are 60% and 40%, respectively. The number of selected urban candidates from B is what percent (up to one decimal place) more/less than the number of selected urban candidates from D?SSC CHSL 2021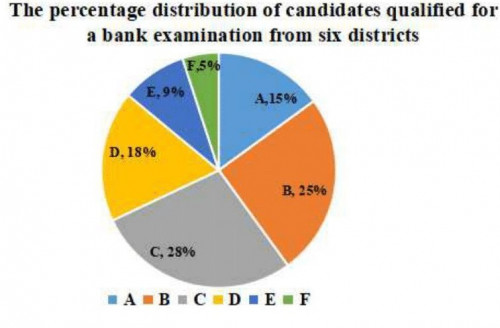
Less, 7.4
28)Study the given graph and answer the question that follows.
In the year 2019, if the imports increased by the same percentage as that in 2018 over its previous year, then what was the amount (in Rs. crores) of the imports in the year 2019?SSC CHSL 2021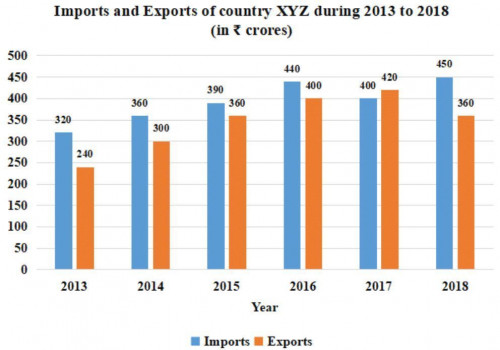
506.25
29)Study the given pie-chart and answer the question that follows
The pie-chart represent the percentage distribution of candidates qualified in a bank examination from six different districts of a State in 2016. The total number of qualified candidates from the State is 68000.
If 22% and 20% of the qualified students from Districts B and C, respectively, were 22 years old or below. then the number of qualified students who were above 22 years from District B is what percent (to the nearest integer) of the number of qualified students who were above 22 years from District C?SSC CHSL 2021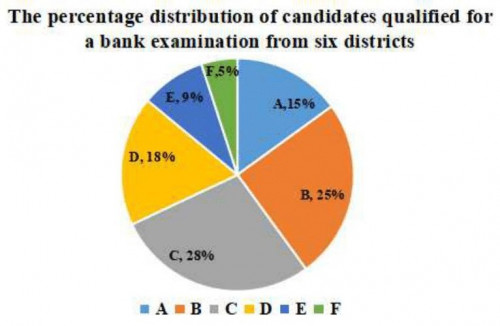
87
30)Study the line graph and answer the question that follows
The line graph represents the number of vehicles (in thousands) manufactured by two automobile companies A and B over the years from 2010 to 2015. The X-axis represents the years and the Y-axis represents the number of vehicles in thousands.
(The data shown here is only for mathematical exercise. They do not represent the actual figures of the country)
What is the difference between the average number of vehicles (in thousands) of companies A and B for the years 2010, 2012,2014, and 2015?SSC CHSL 2021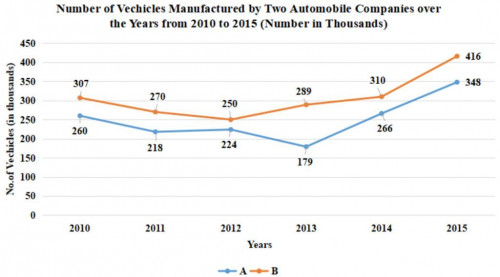
46.25