SSC CHSL 2021 objective Ques (143 results)
11)Study the following bar graph and answer the question that follows.
In how many years was the export more than the average for the given period?
SSC CHSL 2021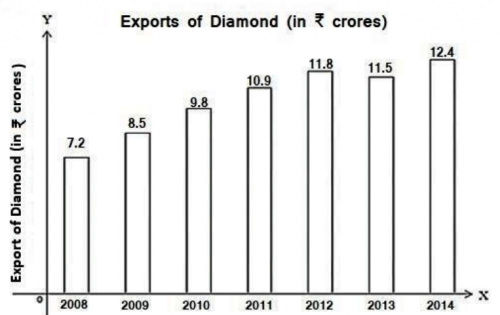
4
12)Study the histogram that shows the marks obtained by students in an examination and answer the question that follows.
By what percentage is the number of students who obtained marks between 200 and 300 more than the number of students who obtained 350 or more marks?
SSC CHSL 2021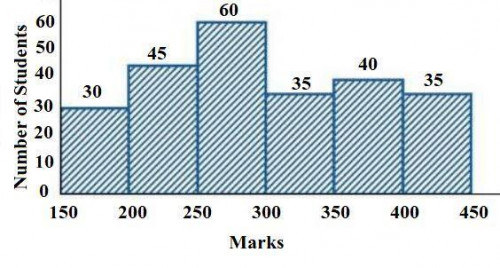
40%
13)Study the given graph and answer the question the follows.
What is the ratio of the total production of sugar in 2014 and 2018 to the total export in 2015 and 2019?
SSC CHSL 2021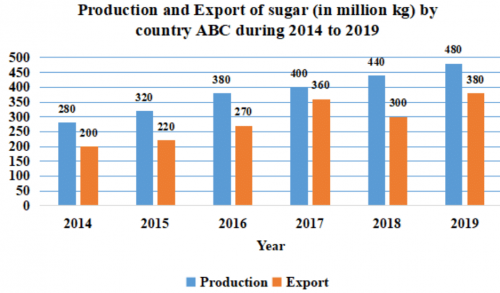
6 : 5
14)Study the given bar graph and answer the question that follows.
The given bar graph represents the Sales Turnover (in Rs. crore) of five automobile companies A, B, C, D and E during 2014-2015 and 2015-2016. The X-axis represents the Companies, and the Y-axis shows the Sales Turnover (in Rs. crore).
(The data shown here is only for mathematical exercise. They do not represent the actual figures of the company.)By what percentage is the average sales turnover of all the companies combined in 2015-2016 more than the average sales turnover of the companies A, C and E in 2014-2015 (to the nearest whole number)?
SSC CHSL 2021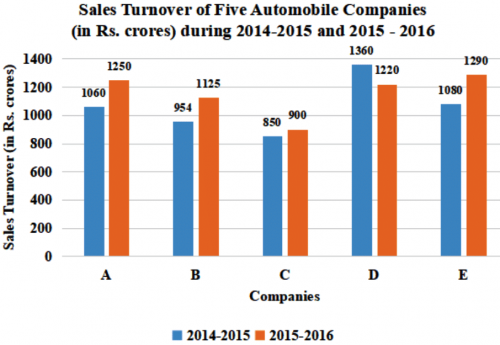
16
15)The given pie chart represents the percentage-wise distribution of 300 students of class X in a school in six different sections A, B, C, D, E and F.
If in section E, the ratio of boys and girls is 4 : 3, then the ratio of the number of girls in section B to that of the number of girls in section E is:
SSC CHSL 2021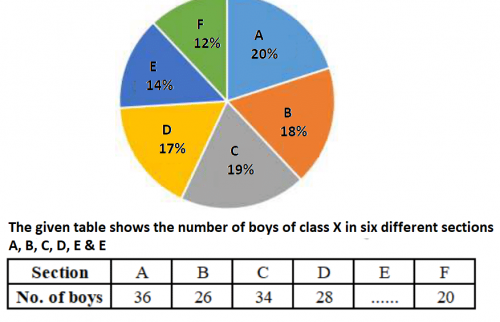
14 : 9
16)Study the given graph and answer the question that follows.
The bar graph shows the percentage distribution of total expenditure of a company under various expense heads during a year.The total expenditure of the company in the year is how many times the expenditure on Research?
SSC CHSL 2021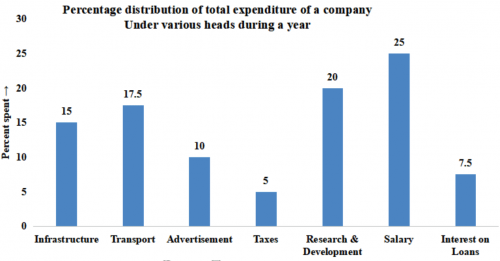
5
17)Study the given graph and answer the question that follows.
By what percentage is 80% of the total export of sugar in 2016, 2017, and 2019 more than the total production in 2015 and 2018 (correct to one decimal place)?
SSC CHSL 2021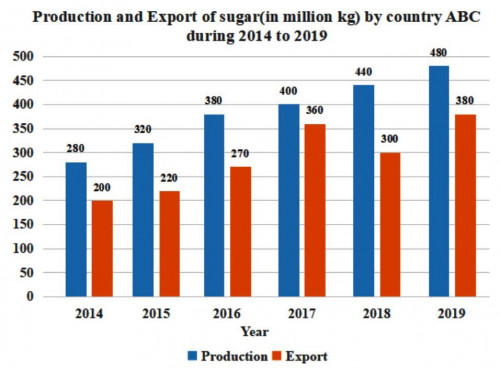
6.3%
18)Study the given bar graph and answer the questions that follows.
The average production in 2002 and 2003 was exactly equal to the average production in which of the following pairs of years?
SSC CHSL 2021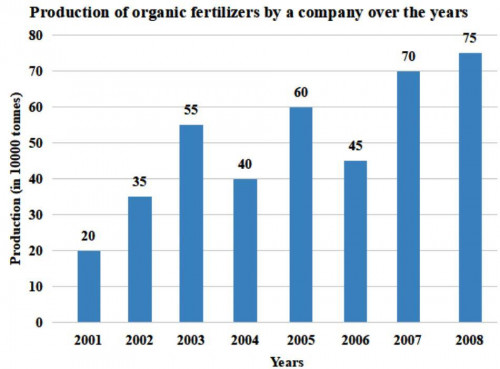
2001 and 2007
SSC CHSL 202119)Study the given table and answer the question that follows.
The table shows the annual consumption (in hundred tones) of tea in five states (A, B, C, D and E) across six years (2014 to 2019)
The consumption of tea in which state and year is closest to the average consumption of tea in State A over six years?
State
Year
A B C D E 2014 112 130 136 105 117 2015 122 138 150 140 120 2016 124 134 142 144 132 2017 132 154 198 149 193 2018 135 148 187 151 145 2019 153 136 198 150 187
B in 2014
20)The given bar graph represents the Sales Turnover (in Rs crore) of five automobile companies A, B, C, D and E during 2014 - 2015 and 2015 - 2016. The X-axis represents the Companies, and the Y-axis shows the Sales Turnover (in Rs crore).
(The data shown here is only for mathematical exercise. They do not represent the actual figures of the company)Which two companies have the same percentage increase in the sales turnover from 2014-2015 to 2015 - 2016?
SSC CHSL 2021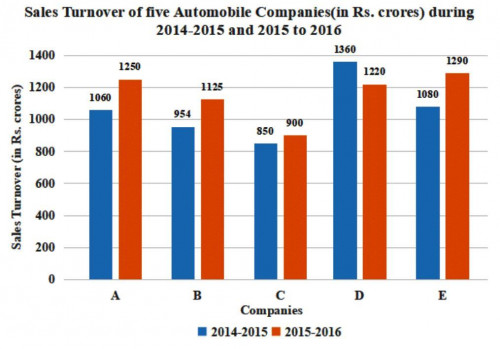
A and B