SSC CHSL 2021 objective Ques (143 results)
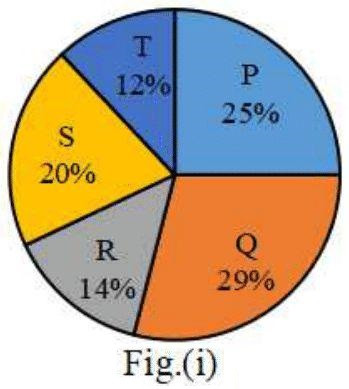
111)Students of Primary, Middle, Secondary, and Sr. Secondary classes collected donations for a Relief Fund as shown in the given pie chart. If the donation collected from the Middle classes was Rs. 6,750, then how much more money was collected by Middle classes as compared to Secondary classes?
SSC CHSL 2021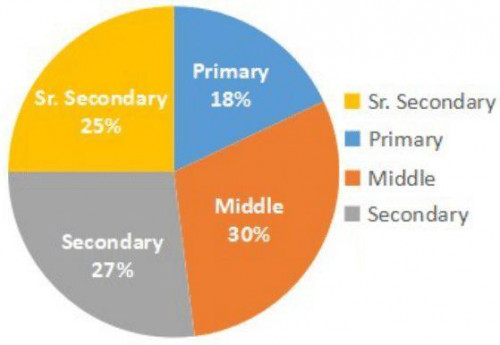
Rs. 675
SSC CHSL 2021112)The histogram shows the marks scored by 40 students in a test with maximum 30 marks.
What is the percentage of the students who scored less than 20 marks?
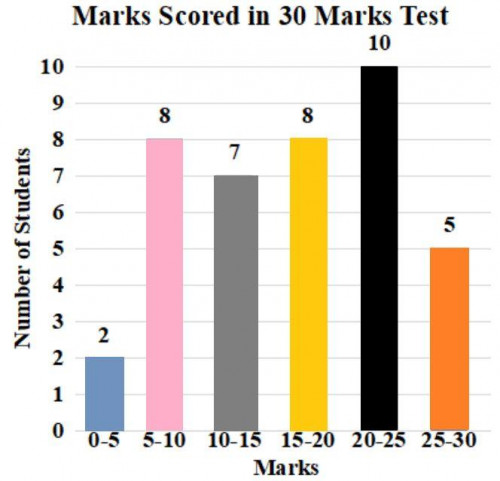
62.5
SSC CHSL 2021113)Study the given graph and answer the question that follows.
\(31\frac{1}{4}\%\) of the total number of vehicles of type A produced in 2013, 2015 and 2017 is equal to the number of vehicles of type B produced in the year:
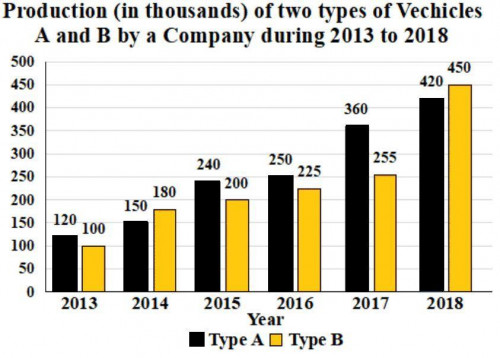
2016
114)Study the given pie charts and answer the question that follows.
The pie charts show the distribution of students of graduate and post graduate levels in five different institutes P, Q, R, S and T in a town.
(i) Total number of students of graduate level in five different institutes = 12400
(ii) Total number of students of post graduate level in five different institutes = 8000
The difference between the average number of students of graduate level in institutes P, R and T to the average number of students of postgraduate level in institutes P, R and T is:SSC CHSL 2021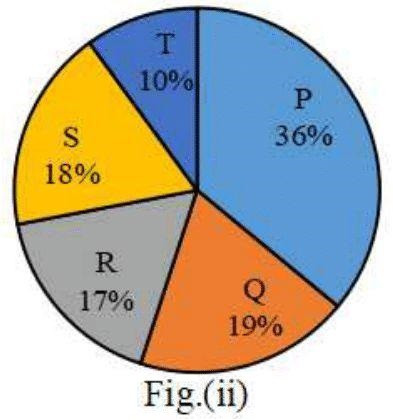
428
SSC CHSL 2021115)Study the following graph and answer the question that follows.
Number of students that appeared and qualified, from various colleges, at a scholarship examination.
What is the ratio of the number of students that appeared to the number of students that qualified at the scholarship examination from College X?
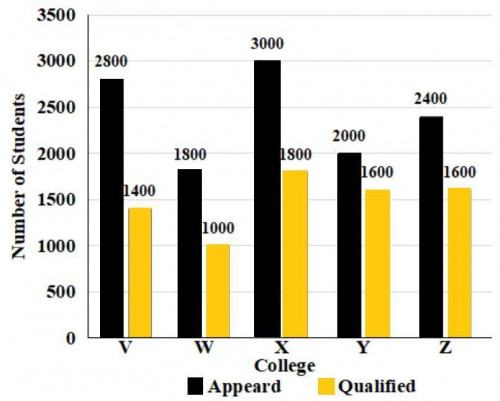
5 : 3
SSC CHSL 2021116)Study the pie chart and answer the question that follows.
The given pie chart shows the degree of the cost incurred in different expenditures on the construction of a house. The total expenditure is Rs.31,50,000.
What is the percentage of expenditure on cement?
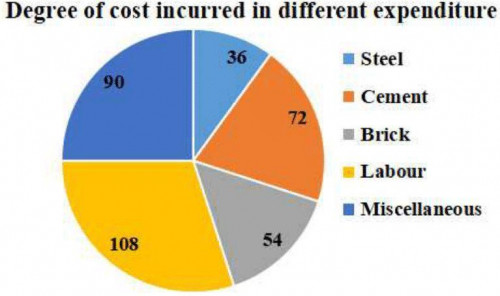
20%
117)Some families went on an outstation tour. The given histogram shows their ages.
What is the ratio of the number of persons of age less than 15 years to that of persons of age less than 30 years?SSC CHSL 2021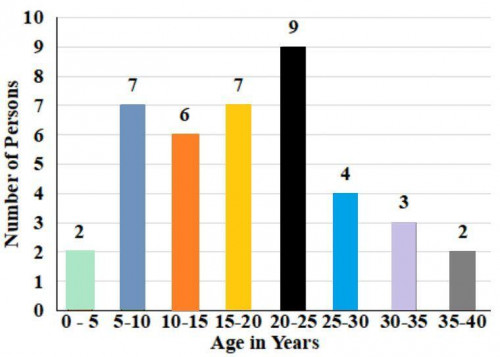
3 ∶ 7
SSC CHSL 2021118)Study the bar graph which show the imports and exports (in Rs.) of steel of a country during 2013 to 2017 and answer the question that follows.
For how many year(s) were the imports less than 80% of the average exports (per year) of the country during the five years?
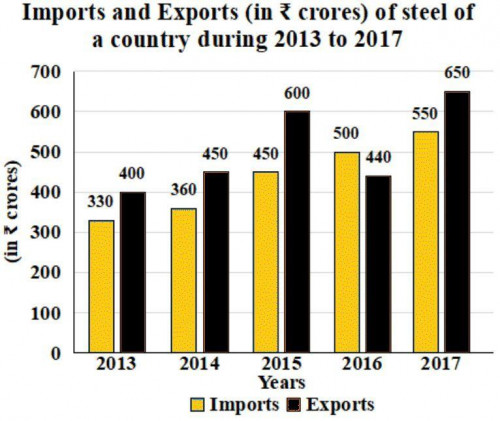
2
SSC CHSL 2021119)Study the graph which shows the target and actual production of ACs, (in thousands) of a factory over five months and answer the question that follows.
The total target production of ACs in February, March, April, and May is what percent less than the total actual production of ACs over five months? (correct to one decimal place)
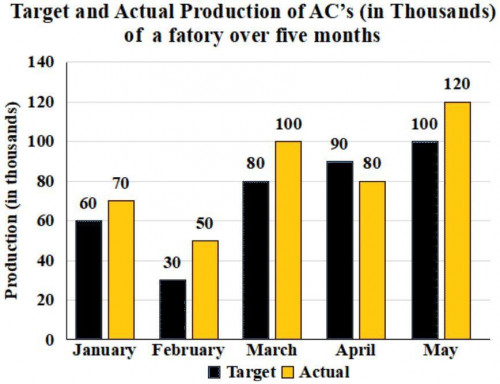
28.6%
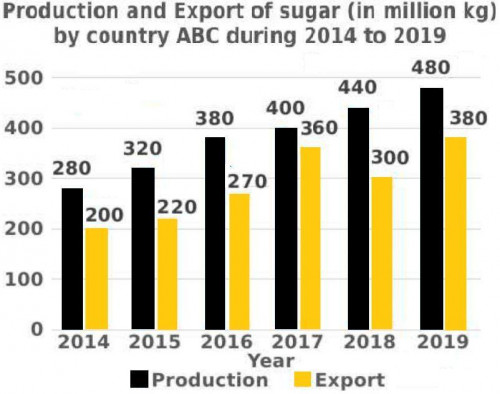
SSC CHSL 2021120)Study the given graph and answer the question that follows.
By what percentage is the average export of sugar in 2016, 2017 and 2018 less than the production in 2017?
 of the total number of vehicles of type A produced in 2013, 2015 and 2017 is equal to the number of vehicles of type B produced in the year:)
 Total number of students of graduate level in five different institutes = 12400<br><img class="img-fluid pr-2 py-1 qImg extra-img" src="https://scorekhel.com/storage/practiceQuestion/Que6608/eng/extra-image.jpg" /><br>(ii) Total number of students of post graduate level in five different institutes = 8000<br>The difference between the average number of students of graduate level in institutes P, R and T to the average number of students of postgraduate level in institutes P, R and T is:)
 Total number of students of graduate level in five different institutes = 12400<br><img class=\"img-fluid pr-2 py-1 qImg extra-img\" src=\"https://scorekhel.com/storage/practiceQuestion/Que6608/eng/extra-image.jpg\" /><br>(ii) Total number of students of post graduate level in five different institutes = 8000<br>The difference between the average number of students of graduate level in institutes P, R and T to the average number of students of postgraduate level in institutes P, R and T is:**%0D%0AA%29 426%0D%0AB%29 425%0D%0AC%29 428%0D%0AD%29 328 %0D%0AClick Link for Answer)
 of steel of a country during 2013 to 2017 and answer the question that follows.<br><img class="img-fluid pr-2 py-1 qImg extra-img" src="https://scorekhel.com/storage/practiceQuestion/Que6715/eng/extra-image.jpg" /><br>For how many year(s) were the imports less than 80% of the average exports (per year) of the country during the five years?)
 of steel of a country during 2013 to 2017 and answer the question that follows.<br><img class=\"img-fluid pr-2 py-1 qImg extra-img\" src=\"https://scorekhel.com/storage/practiceQuestion/Que6715/eng/extra-image.jpg\" /><br>For how many year(s) were the imports less than 80% of the average exports (per year) of the country during the five years?**%0D%0AA%29 3%0D%0AB%29 4%0D%0AC%29 2%0D%0AD%29 1 %0D%0AClick Link for Answer)
 of a factory over five months and answer the question that follows.<br><img class="img-fluid pr-2 py-1 qImg extra-img" src="https://scorekhel.com/storage/practiceQuestion/Que6717/eng/extra-image.jpg" /><br>The total target production of ACs in February, March, April, and May is what percent less than the total actual production of ACs over five months? (correct to one decimal place))
 of a factory over five months and answer the question that follows.<br><img class=\"img-fluid pr-2 py-1 qImg extra-img\" src=\"https://scorekhel.com/storage/practiceQuestion/Que6717/eng/extra-image.jpg\" /><br>The total target production of ACs in February, March, April, and May is what percent less than the total actual production of ACs over five months? (correct to one decimal place)**%0D%0AA%29 28.6%%0D%0AB%29 26.8%%0D%0AC%29 29.7%%0D%0AD%29 27.9% %0D%0AClick Link for Answer)
22.5%