SSC CGL 2022 objective Ques (132 results)
SSC CGL 202281)The breakup of the total number of employees of a company working in different offices (A to E), in degrees, is given in the pie chart. The total number of employees = 2400.
If the percentage of male employees in office C is 20% and that of female employees in E is 40%, then what is the ratio of the numbers of female employees in E to that of female employees in C?
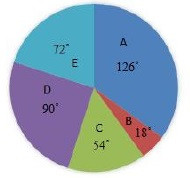
2 ∶ 3
SSC CGL 202282)The given pie chart shows the percentage of students in five schools and the table shows the ratio of boys and girls in each school.
Study the pie chart and table and answer the question that follows.
The below table shows the ratio of girls and boys in the given five schools.
The number of girls in school D is what percentage less than the number of boys in school B (correct to the nearest integer)?
School Girls ∶ Boys A 3 ∶ 4 B 2 ∶ 3 C 5 ∶ 3 D 1 ∶ 2 E 4 ∶ 1
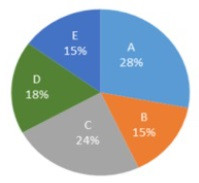
33%
83)The following bar graph shows the total number of youth (in lakhs) and the number of employed youth (in lakhs) in 5 states A, B, C, D and E.
How many youth (in lakhs) are unemployed in states B and D taken together?SSC CGL 2022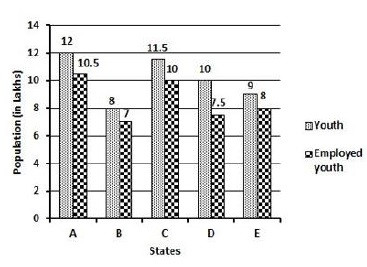
3.5
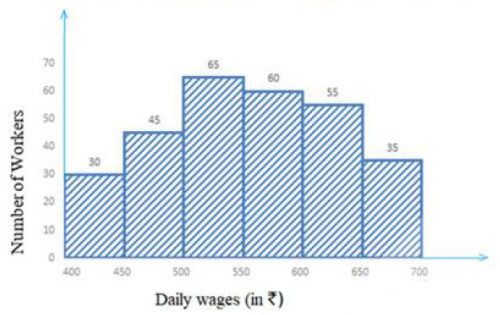
SSC CGL 202284)Study the graph and answer the question that follows.
What is the ratio of the total number of workers whose daily wages are less than ₹450 to the total number of workers whose daily wages are ₹650 and above?
, in degrees, is given in the pie chart. The total number of employees = 2400.<br><img class="img-fluid pr-2 py-1 qImg extra-img" src="https://scorekhel.com/storage/practiceQuestion/Que12405/eng/extra-image.jpg" /><br> If the percentage of male employees in office C is 20% and that of female employees in E is 40%, then what is the ratio of the numbers of female employees in E to that of female employees in C?)
, in degrees, is given in the pie chart. The total number of employees = 2400.<br><img class=\"img-fluid pr-2 py-1 qImg extra-img\" src=\"https://scorekhel.com/storage/practiceQuestion/Que12405/eng/extra-image.jpg\" /><br> If the percentage of male employees in office C is 20% and that of female employees in E is 40%, then what is the ratio of the numbers of female employees in E to that of female employees in C?**%0D%0AA%29 3 ∶ 2%0D%0AB%29 3 ∶ 8%0D%0AC%29 5 ∶ 4%0D%0AD%29 2 ∶ 3 %0D%0AClick Link for Answer)
?<br> <div class="mce-resize-bar mce-resize-bar-row" data-mce-bogus="all" data-mce-resize="false" data-mce-style="cursor: row-resize; margin: 0; padding: 0; position: absolute; left: 10px; top: 134.5px; height: 4px; width: 174px; " data-row="0" style=" margin: 0px; padding: 0px; position: absolute; left: 10px; top: 134.5px; height: 4px; width: 174px;" unselectable="on"> </div> <div class="mce-resize-bar mce-resize-bar-row" data-mce-bogus="all" data-mce-resize="false" data-mce-style="cursor: row-resize; margin: 0; padding: 0; position: absolute; left: 10px; top: 155.5px; height: 4px; width: 174px; " data-row="1" style=" margin: 0px; padding: 0px; position: absolute; left: 10px; top: 155.5px; height: 4px; width: 174px;" unselectable="on"> </div> <div class="mce-resize-bar mce-resize-bar-row" data-mce-bogus="all" data-mce-resize="false" data-mce-style="cursor: row-resize; margin: 0; padding: 0; position: absolute; left: 10px; top: 176.5px; height: 4px; width: 174px; " data-row="2" style=" margin: 0px; padding: 0px; position: absolute; left: 10px; top: 176.5px; height: 4px; width: 174px;" unselectable="on"> </div> <div class="mce-resize-bar mce-resize-bar-row" data-mce-bogus="all" data-mce-resize="false" data-mce-style="cursor: row-resize; margin: 0; padding: 0; position: absolute; left: 10px; top: 197.5px; height: 4px; width: 174px; " data-row="3" style=" margin: 0px; padding: 0px; position: absolute; left: 10px; top: 197.5px; height: 4px; width: 174px;" unselectable="on"> </div> <div class="mce-resize-bar mce-resize-bar-row" data-mce-bogus="all" data-mce-resize="false" data-mce-style="cursor: row-resize; margin: 0; padding: 0; position: absolute; left: 10px; top: 218.5px; height: 4px; width: 174px; " data-row="4" style=" margin: 0px; padding: 0px; position: absolute; left: 10px; top: 218.5px; height: 4px; width: 174px;" unselectable="on"> </div> <div class="mce-resize-bar mce-resize-bar-row" data-mce-bogus="all" data-mce-resize="false" data-mce-style="cursor: row-resize; margin: 0; padding: 0; position: absolute; left: 10px; top: 239.5px; height: 4px; width: 174px; " data-row="5" style=" margin: 0px; padding: 0px; position: absolute; left: 10px; top: 239.5px; height: 4px; width: 174px;" unselectable="on"> </div> <div class="mce-resize-bar mce-resize-bar-col" data-col="0" data-mce-bogus="all" data-mce-resize="false" data-mce-style="cursor: col-resize; margin: 0; padding: 0; position: absolute; left: 72.984375px; top: 115px; height: 127px; width: 4px; " style=" margin: 0px; padding: 0px; position: absolute; left: 72.9844px; top: 115px; height: 127px; width: 4px;" unselectable="on"> </div>)
?<br> <div class=\"mce-resize-bar mce-resize-bar-row\" data-mce-bogus=\"all\" data-mce-resize=\"false\" data-mce-style=\"cursor: row-resize; margin: 0; padding: 0; position: absolute; left: 10px; top: 134.5px; height: 4px; width: 174px; \" data-row=\"0\" style=\" margin: 0px; padding: 0px; position: absolute; left: 10px; top: 134.5px; height: 4px; width: 174px;\" unselectable=\"on\"> </div> <div class=\"mce-resize-bar mce-resize-bar-row\" data-mce-bogus=\"all\" data-mce-resize=\"false\" data-mce-style=\"cursor: row-resize; margin: 0; padding: 0; position: absolute; left: 10px; top: 155.5px; height: 4px; width: 174px; \" data-row=\"1\" style=\" margin: 0px; padding: 0px; position: absolute; left: 10px; top: 155.5px; height: 4px; width: 174px;\" unselectable=\"on\"> </div> <div class=\"mce-resize-bar mce-resize-bar-row\" data-mce-bogus=\"all\" data-mce-resize=\"false\" data-mce-style=\"cursor: row-resize; margin: 0; padding: 0; position: absolute; left: 10px; top: 176.5px; height: 4px; width: 174px; \" data-row=\"2\" style=\" margin: 0px; padding: 0px; position: absolute; left: 10px; top: 176.5px; height: 4px; width: 174px;\" unselectable=\"on\"> </div> <div class=\"mce-resize-bar mce-resize-bar-row\" data-mce-bogus=\"all\" data-mce-resize=\"false\" data-mce-style=\"cursor: row-resize; margin: 0; padding: 0; position: absolute; left: 10px; top: 197.5px; height: 4px; width: 174px; \" data-row=\"3\" style=\" margin: 0px; padding: 0px; position: absolute; left: 10px; top: 197.5px; height: 4px; width: 174px;\" unselectable=\"on\"> </div> <div class=\"mce-resize-bar mce-resize-bar-row\" data-mce-bogus=\"all\" data-mce-resize=\"false\" data-mce-style=\"cursor: row-resize; margin: 0; padding: 0; position: absolute; left: 10px; top: 218.5px; height: 4px; width: 174px; \" data-row=\"4\" style=\" margin: 0px; padding: 0px; position: absolute; left: 10px; top: 218.5px; height: 4px; width: 174px;\" unselectable=\"on\"> </div> <div class=\"mce-resize-bar mce-resize-bar-row\" data-mce-bogus=\"all\" data-mce-resize=\"false\" data-mce-style=\"cursor: row-resize; margin: 0; padding: 0; position: absolute; left: 10px; top: 239.5px; height: 4px; width: 174px; \" data-row=\"5\" style=\" margin: 0px; padding: 0px; position: absolute; left: 10px; top: 239.5px; height: 4px; width: 174px;\" unselectable=\"on\"> </div> <div class=\"mce-resize-bar mce-resize-bar-col\" data-col=\"0\" data-mce-bogus=\"all\" data-mce-resize=\"false\" data-mce-style=\"cursor: col-resize; margin: 0; padding: 0; position: absolute; left: 72.984375px; top: 115px; height: 127px; width: 4px; \" style=\" margin: 0px; padding: 0px; position: absolute; left: 72.9844px; top: 115px; height: 127px; width: 4px;\" unselectable=\"on\"> </div>**%0D%0AA%29 35%%0D%0AB%29 33%%0D%0AC%29 19%%0D%0AD%29 27% %0D%0AClick Link for Answer)
6 ∶ 7
SSC CGL 202285)The following table shows the number of pages printed by 3 printers during 3 days.
What is the average number of pages printed by printer Z during the 3 days?
Printers/Days X Y Z Monday 130 140 210 Tuesday 110 145 160 Wednesday 180 90 218
196
86)The pie chart given below shows the number of truck sold by 8 different companies. The total number of truck sold by all these 8 companies are 4000. Number of truck sold by a particular company is shown as a percent of total number of truck sold by all these 8 companies.
The number of trucks sold by B, C, F and H is how much percent less than the number of trucks sold by all these 8 companies?SSC CGL 2022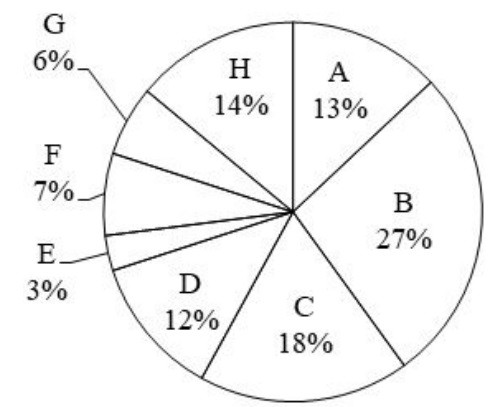
34 percent
SSC CGL 202287)The table given below shows the number of spoon manufactured by five factories.
What are the ratio of number of spoon manufactured by P to the number of spoon manufactured by R?
Factory Spoon P 100 Q 200 R 150 S 50 T 250
2 : 3
88)The following bar graph shows the sales of books (in thousands) from six branches of a publishing company during two consecutive years 2018 and 2019.
What is the ratio of the total sales of the first branch for for both years to the total sales of the fourth branch for both years?SSC CGL 2022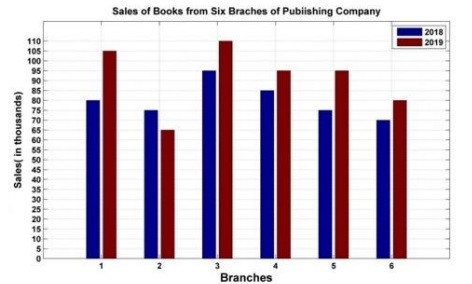
37 ∶ 36
89)Study the given chart and answer the following question.
What is the central angle corresponding to the production steel by Kerala?SSC CGL 2022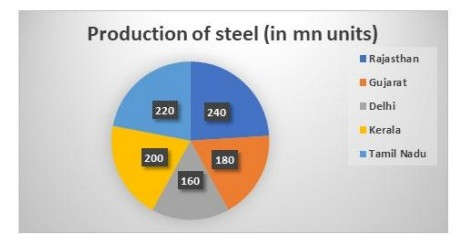
72°
SSC CGL 202290)The following table shows the number of different items in different shops and their respective selling prices per unit.
Find the percentage of total revenue which comes from Cooler from shop E, considering all given items are being sold from shop E and from all the given shops only given three items are being sold. (Rounded off to three decimal places)
Shops
Total No. of Items
AC ∶ Cooler ∶ Fan
Selling Price per unit
Cooler
AC
Fan
A
5000
4 ∶ 5 ∶ 1
8000
25000
8500
B
1800
3 ∶ 2 ∶ 4
10000
20000
16000
C
3400
6 ∶ 4 ∶ 7
6000
42000
15000
D
3600
4 ∶ 2 ∶ 3
12000
32000
8000
E
4000
5 ∶ 1 ∶ 4
8000
26500
12200
F
1210
2 ∶ 4 ∶ 5
11000
28000
11100
4.226%