SSC CGL 2022 objective Ques (132 results)
71)Performance of 1800 students in grades has been shown in the following pie chart.
How many more students have obtained grade B than those who have obtained grade C?SSC CGL 2022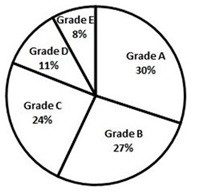
54
72)The number of cars passing the road near a colony from 6 am to 12 noon has been shown in the following histogram.
During which hour(s) is the number of cars passed less than the average number of cars passed from 7 am to 12 noon?SSC CGL 2022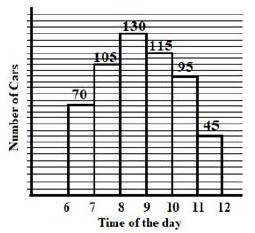
6-7, 10-11, 11-12
73)The following histogram shows the marks scored by 40 students in a test of 30 marks. A student has to score a minimum of 10 marks to pass the test.
What is the percentage of students who passed the test?SSC CGL 2022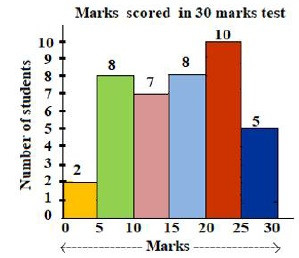
75%
74)The following bar graph shows receipts and expenditure by a business firm over 5 years. Gain = Receipts - Expenditure.
In which year did the company gain the minimum amount?SSC CGL 2022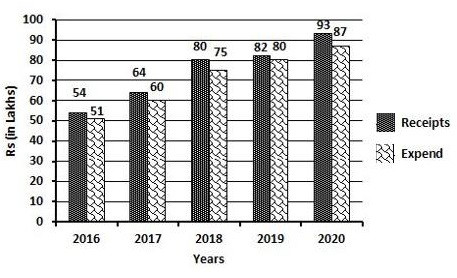
2019
75)Performance of 1800 students in grades has been shown in the following pie chart.
The number of students getting grade B is what percentage of the number of students getting grade A?
SSC CGL 2022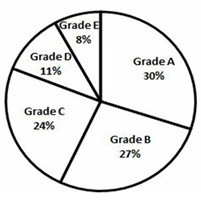
90%
SSC CGL 202276)The breakup of the total number of employees of a company working in different offices (A to E), in degrees, is given in the pie chart.
The total number of employees = 2400.
If 40% of the number of employees in office A are shifted equally to offices B and E, then what will be the sum of the number of employees in B and C?
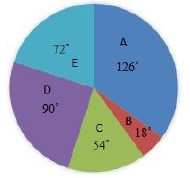
648
SSC CGL 202277)Study the histogram and answer the question given below.
The graph represents the number of students obtaining a percentage of marks in class X Board examination in 2018 in a school.
The number of students who have secured less than 60% marks is what per cent less than the number of students who have secured 80% marks and above?
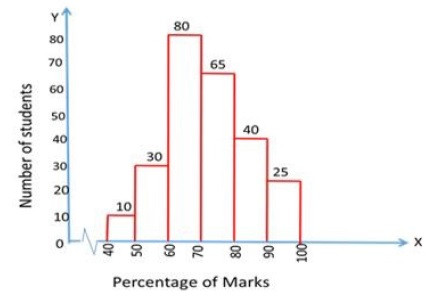
38.5%
78)The following pie charts show the number of students studying in different departments of an institute during the academic years 2019 and 2020. The total number of students was 2000 and 2400, respectively, in the academic years 2019 and 2020.
What are the ratio of Commerce and Computer Science students taken together in 2019 to Engineering and Medical students taken together in 2020?SSC CGL 2022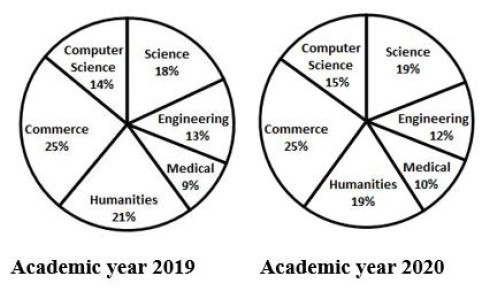
65 ∶ 44
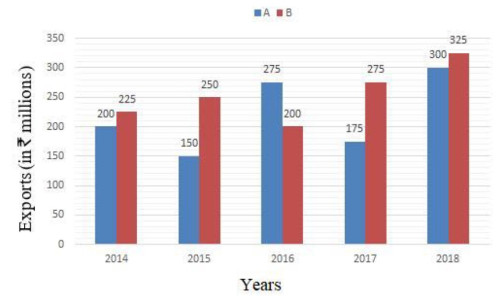
SSC CGL 202279)The following bar graph shows exports of cars of type A and B (in ₹ millions) from 2014 to 2018. Study the graph and answer the question that follows.
Exports of Cars of Type A and B (in ₹ millions) during 2014 to 2018.
The total exports of cars of type A in 2014 to 2018 is what per cent more than the total exports of cars of type B in 2015 to 2017? (Correct to one decimal place)
, in degrees, is given in the pie chart.<br> The total number of employees = 2400.<br><img class="img-fluid pr-2 py-1 qImg extra-img" src="https://scorekhel.com/storage/practiceQuestion/Que12203/eng/extra-image.jpg" /><br> If 40% of the number of employees in office A are shifted equally to offices B and E, then what will be the sum of the number of employees in B and C?)
, in degrees, is given in the pie chart.<br> The total number of employees = 2400.<br><img class=\"img-fluid pr-2 py-1 qImg extra-img\" src=\"https://scorekhel.com/storage/practiceQuestion/Que12203/eng/extra-image.jpg\" /><br> If 40% of the number of employees in office A are shifted equally to offices B and E, then what will be the sum of the number of employees in B and C?**%0D%0AA%29 545%0D%0AB%29 735%0D%0AC%29 648%0D%0AD%29 72 %0D%0AClick Link for Answer)
 from 2014 to 2018. Study the graph and answer the question that follows.<br> Exports of Cars of Type A and B (in ₹ millions) during 2014 to 2018.<br><img class="img-fluid pr-2 py-1 qImg extra-img" src="https://scorekhel.com/storage/practiceQuestion/Que12319/eng/extra-image.jpg" /><br> The total exports of cars of type A in 2014 to 2018 is what per cent more than the total exports of cars of type B in 2015 to 2017? (Correct to one decimal place))
 from 2014 to 2018. Study the graph and answer the question that follows.<br> Exports of Cars of Type A and B (in ₹ millions) during 2014 to 2018.<br><img class=\"img-fluid pr-2 py-1 qImg extra-img\" src=\"https://scorekhel.com/storage/practiceQuestion/Que12319/eng/extra-image.jpg\" /><br> The total exports of cars of type A in 2014 to 2018 is what per cent more than the total exports of cars of type B in 2015 to 2017? (Correct to one decimal place)**%0D%0AA%29 50.4%%0D%0AB%29 51.7%%0D%0AC%29 41.3%%0D%0AD%29 44.3% %0D%0AClick Link for Answer)
51.7%
80)Monthly expenditure of a family on different heads is shown in the following pie chart. The family earns ₹1,08,000 every month.
What is the amount spent on Rent every month (in ₹)?SSC CGL 2022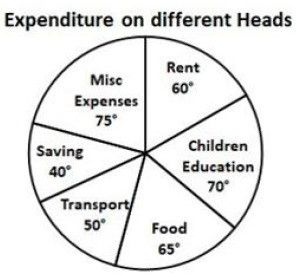
18,000