SSC CGL 2022 objective Ques (132 results)
SSC CGL 202261)The given bar chart represents the number of Televisions Sets (TV) manufactured (in thousands) and the respective percentage of those TV Sets sold by five different companies A, B, C, D and E in 2015.
Study the chart carefully and answer the question that follows.
The average number of TV sets sold by companies C and D is what percentage of the number of TV sets manufactured by company E? Express your answer correct to one place of decimal.
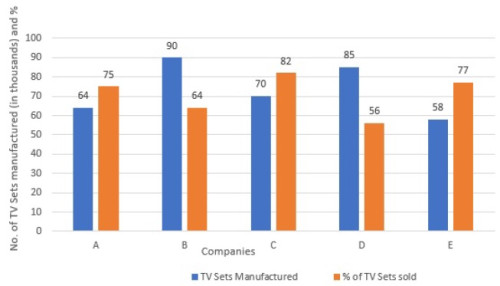
90.5%
62)The number of cars passing the road near a colony from 6 am to 12 noon has been shown in the following histogram.
What is the minimum change percentage in the number of cars in comparison to the previous hour? (correct to 2 decimal places)SSC CGL 2022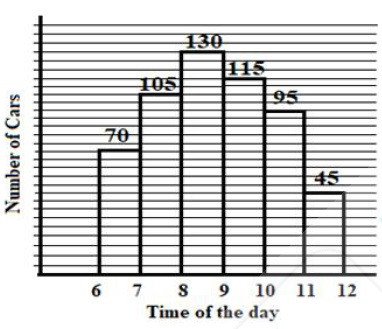
11.54%
SSC CGL 202263)The following pie chart shows the distribution of percentage of a certain corporate office employees in various age-groups.
Total number of employees of the corporate office = 2500
Study the chart carefully and answer the question that follows.
The number of the corporate office employees of age group of 38+ years and above is how much percentage more than that of 28+ to 38 years?
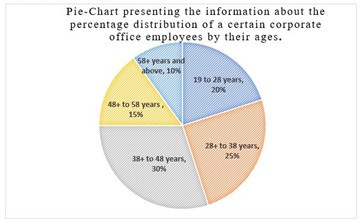
120%
SSC CGL 202264)Study the given bar graph and answer the question that follows.
The bar graph shows the exports of cars of type A and B (in ₹ millions) from 2014 2018..
The total exports of cars of type A from 2014 to 2016 is approximately what percentage less than the total exports of cars of type B from 2015 to 2017 (correct to one decimal place)?
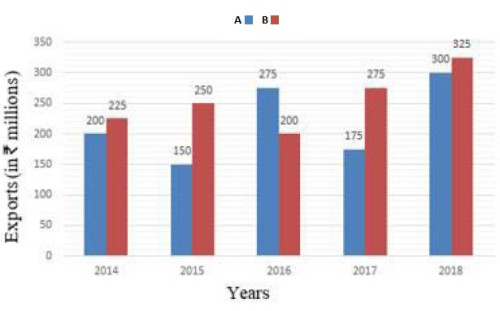
13.8%
SSC CGL 202265)Study the given bar graph and answer the question that follows.
The bar graph shows the exports of cars of type A and B (in ₹ millions) from 2014 to 2018.
In which year were the exports of cars of type B ₹20 million less than the average exports (per year) of cars of type A over the five years?
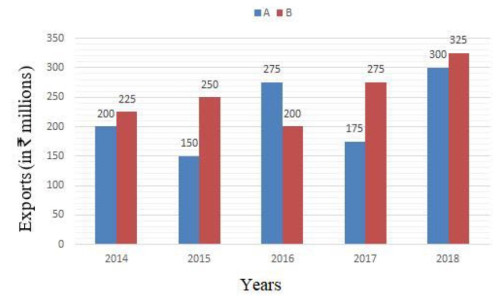
2016
SSC CGL 202266)The given histogram shows the heights of 232 students of an athletic club and their numbers.
Study the histogram carefully and answer the questions that follows.
If the histogram is to be presented by a line diagram, what would be the starting point and the end point of the line diagram?
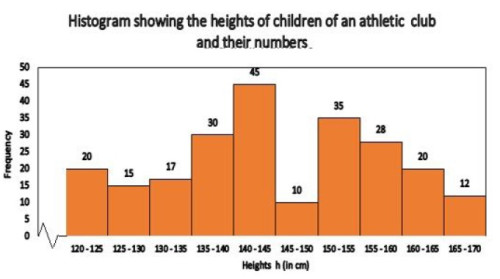
(117.5,0) and (172.5,0)
SSC CGL 202267)Study the given pie chart and answer the question that follows.
The pie chart shows the breakup of the total number of employees of a company working in different offices (A to E), in degrees. The total number of employees = 3600.
If the percentage of male employees in office C is 20% and that of female employees in office D is 40%, then what is the ratio of the number of female employees in office D to that of female employees in office C?
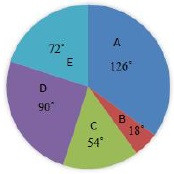
5 : 6
68)The following bar graph shows receipts and expenditure of business firm over 5 years. Gain = Receipts - Expenditure.
What is the percentage of increase in expenditure from 2018 to 2019 as compared to 2018?SSC CGL 2022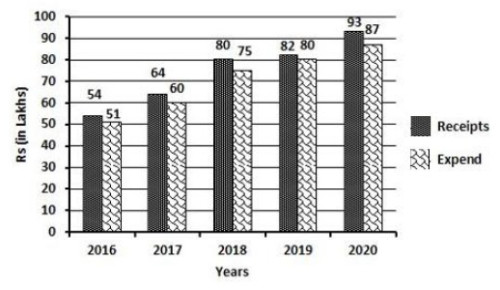
\(6{2\over3}\)
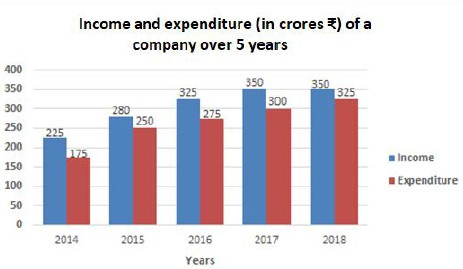
SSC CGL 202269)The given bar graph shows the income and expenditure (in crores ₹) of a company over 5 years, from 2014 to 2018. Study the bar graph and answer the question that follows.
What is the difference (in crores ₹) between the expenditure for the years 2017 and 2018 taken together and the income for the years 2015 and 2016 taken together?
 manufactured (in thousands) and the respective percentage of those TV Sets sold by five different companies A, B, C, D and E in 2015.<br> Study the chart carefully and answer the question that follows.<br><img class="img-fluid pr-2 py-1 qImg extra-img" src="https://scorekhel.com/storage/practiceQuestion/Que11899/eng/extra-image.jpg" /><br> The average number of TV sets sold by companies C and D is what percentage of the number of TV sets manufactured by company E? Express your answer correct to one place of decimal.)
 manufactured (in thousands) and the respective percentage of those TV Sets sold by five different companies A, B, C, D and E in 2015.<br> Study the chart carefully and answer the question that follows.<br><img class=\"img-fluid pr-2 py-1 qImg extra-img\" src=\"https://scorekhel.com/storage/practiceQuestion/Que11899/eng/extra-image.jpg\" /><br> The average number of TV sets sold by companies C and D is what percentage of the number of TV sets manufactured by company E? Express your answer correct to one place of decimal.**%0D%0AA%29 92.2%%0D%0AB%29 89.1%%0D%0AC%29 86.5%%0D%0AD%29 90.5% %0D%0AClick Link for Answer)
 from 2014 2018..<br><img class="img-fluid pr-2 py-1 qImg extra-img" src="https://scorekhel.com/storage/practiceQuestion/Que11914/eng/extra-image.jpg" /><br> The total exports of cars of type A from 2014 to 2016 is approximately what percentage less than the total exports of cars of type B from 2015 to 2017 (correct to one decimal place)?)
from 2014 2018..<br><img class=\"img-fluid pr-2 py-1 qImg extra-img\" src=\"https://scorekhel.com/storage/practiceQuestion/Que11914/eng/extra-image.jpg\" /><br> The total exports of cars of type A from 2014 to 2016 is approximately what percentage less than the total exports of cars of type B from 2015 to 2017 (correct to one decimal place)?**%0D%0AA%29 11.3%%0D%0AB%29 10.4%%0D%0AC%29 13.8%%0D%0AD%29 11.7% %0D%0AClick Link for Answer)
 from 2014 to 2018.<br><img class="img-fluid pr-2 py-1 qImg extra-img" src="https://scorekhel.com/storage/practiceQuestion/Que12032/eng/extra-image.jpg" /><br> In which year were the exports of cars of type B ₹20 million less than the average exports (per year) of cars of type A over the five years?)
 from 2014 to 2018.<br><img class=\"img-fluid pr-2 py-1 qImg extra-img\" src=\"https://scorekhel.com/storage/practiceQuestion/Que12032/eng/extra-image.jpg\" /><br> In which year were the exports of cars of type B ₹20 million less than the average exports (per year) of cars of type A over the five years?**%0D%0AA%29 2015%0D%0AB%29 2014%0D%0AC%29 2016%0D%0AD%29 2017 %0D%0AClick Link for Answer)
 and (167.5,0)%0D%0AB%29 (117.5,0) and (172.5,0)%0D%0AC%29 (117.5,20) and (172.5,20)%0D%0AD%29 (122.5,20) and (167.5,20) %0D%0AClick Link for Answer)
, in degrees. The total number of employees = 3600.<br><img class="img-fluid pr-2 py-1 qImg extra-img" src="https://scorekhel.com/storage/practiceQuestion/Que12043/eng/extra-image.jpg" /><br> If the percentage of male employees in office C is 20% and that of female employees in office D is 40%, then what is the ratio of the number of female employees in office D to that of female employees in office C?)
, in degrees. The total number of employees = 3600.<br><img class=\"img-fluid pr-2 py-1 qImg extra-img\" src=\"https://scorekhel.com/storage/practiceQuestion/Que12043/eng/extra-image.jpg\" /><br> If the percentage of male employees in office C is 20% and that of female employees in office D is 40%, then what is the ratio of the number of female employees in office D to that of female employees in office C?**%0D%0AA%29 3 : 2%0D%0AB%29 3 : 8%0D%0AC%29 2 : 3%0D%0AD%29 5 : 6 %0D%0AClick Link for Answer)
 of a company over 5 years, from 2014 to 2018. Study the bar graph and answer the question that follows.<br><img class="img-fluid pr-2 py-1 qImg extra-img" src="https://scorekhel.com/storage/practiceQuestion/Que12104/eng/extra-image.jpg" /><br> What is the difference (in crores ₹) between the expenditure for the years 2017 and 2018 taken together and the income for the years 2015 and 2016 taken together?)
 of a company over 5 years, from 2014 to 2018. Study the bar graph and answer the question that follows.<br><img class=\"img-fluid pr-2 py-1 qImg extra-img\" src=\"https://scorekhel.com/storage/practiceQuestion/Que12104/eng/extra-image.jpg\" /><br> What is the difference (in crores ₹) between the expenditure for the years 2017 and 2018 taken together and the income for the years 2015 and 2016 taken together?**%0D%0AA%29 16%0D%0AB%29 20%0D%0AC%29 15%0D%0AD%29 18 %0D%0AClick Link for Answer)
20
70)The following bar graph shows the number of youth (in lakhs) and the number of employed youth (in lakhs) in five states A, B, C, D and E.
What is the average number of youth in the five states?SSC CGL 2022
1010000