SSC CGL 2022 objective Ques (132 results)
SSC CGL 202251)The following pie charts show the number of students studying in different departments of an institute during the academic years 2019 and 2020. The total number of students was 2000 and 2400 in academic years 2019 and 2020, respectively.
Students studying humanities in 2019 and 2020 taken together is what percentage of the total number of students studying during the two years taken together? (correct to 2 decimal places)

19.91%
SSC CGL 202252)A vegetable vendor supplies vegetables to a housing complex of 50 families. On a particular day, the break-up sale of vegetables is represented in the form of a pie chart as shown. Study the pie chart carefully and answer the question that follows.
Sale of Vegetables(in kg) on a particular day in housing complex of 50 families
What is the ratio of the central angle corresponding to the sale of potatoes, tomatoes and beans together to the central angle corresponding to the combined sale of onions and others?
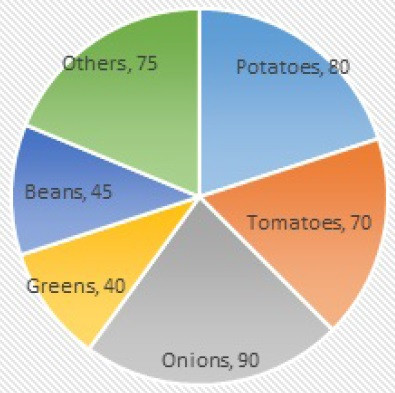
13 : 11
SSC CGL 202253)Study the given bar graph and answer the question that follows.
The bar graph shows the exports of cars of type A and B (in Rs. millions) from 2014 to 2018.
The total exports of cars of type B from 2015 to 2018 is what percentage more than the total exports of cars of type A from 2015 to 2018 (correct to one decimal place)?
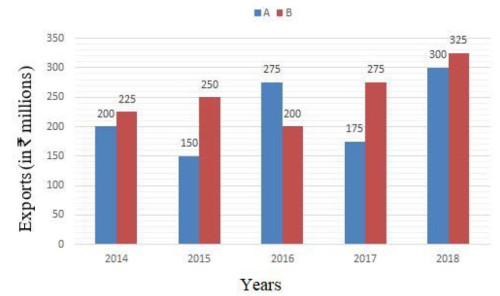
16.7%
SSC CGL 202254)The following pie-charts show the number of students studying in different departments of an institute during the academic years 2019 and 2020. The total number of students was 2000 and 2400, respectively, in academic years 2019 and 2020.
What is the ratio of the number of students studying science in the year 2019 to that in the year 2020?
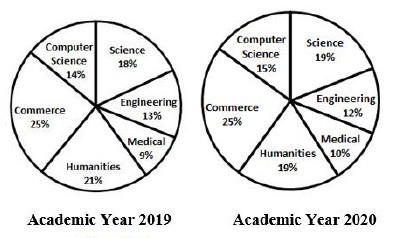
15 ∶ 19
SSC CGL 202255)Study the given histogram and answer the question that follows.
The histogram represents the percentage of marks obtained by a number of a students of a school in the class X Board Examination in 2018. The total number of students = 250.
The number of students who have obtained less than 50% marks is approximately what percentage less than the number of students who have obtained 90% marks and above?
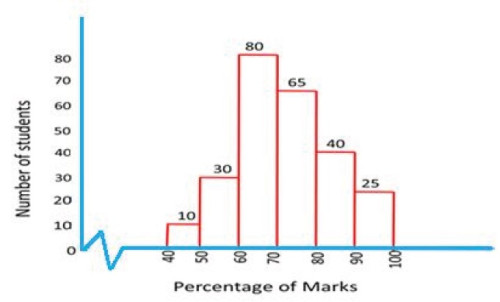
60%
56)The given pie charts show the number of start-ups in various industries since 2010 and the number of successful start-ups in those industries.
Study the charts and answer the question: What should be the increase in the number (to the nearest integer) of successful start-ups in the industry of Health & sports, so that its success percentage is the same as that of Education?
Start-ups in various industries started since 2010
Successful start-ups in various industriesSSC CGL 2022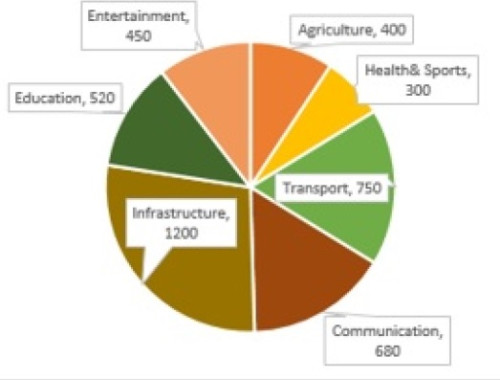
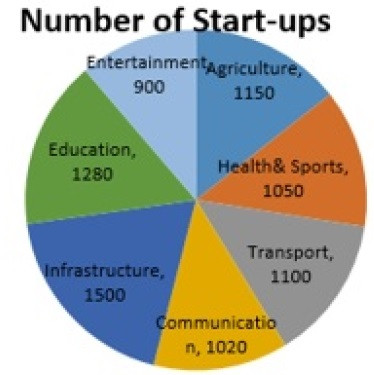
127
SSC CGL 202257)The given histogram represents the marks of students in Mathematics test of a certain class.
The total number of students is 350 and the maximum marks of the test are 200.
Study the graph and answer the question that follows.
The total number of students whose marks are less than 100 is what percentage (correct up to one place of decimal) less than the total number of students whose marks are 120 and above?
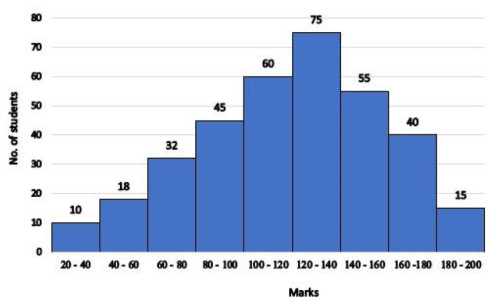
43.2%
58)The following bar graph shows receipts and expenditure by a business firm over 5 years. Gain = Receipts - Expenditure.
In which year did the company gain the maximum amount?SSC CGL 2022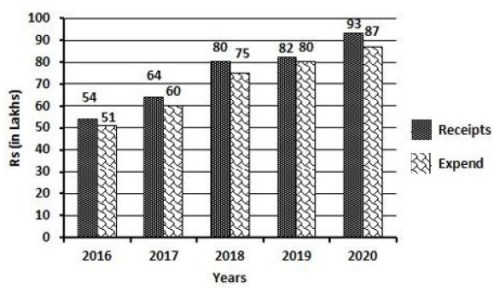
2020
59)Performance of 1800 students in grades has been shown in the following pie chart.
How many students have got either grade D or grade E?SSC CGL 2022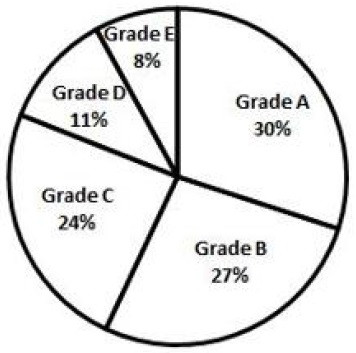
342
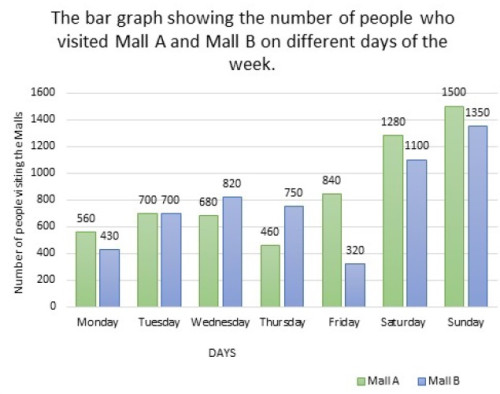
SSC CGL 202260)The bar graph shows the number of people who visited Mall A and B on different days of a week.
What is the ratio of the number of people visiting Mall A on Thursday, Saturday and Sunday together to the number of people visiting Mall B on these three days together?
 <br> <br>)
 <br> <br>**%0D%0AA%29 19.91%%0D%0AB%29 18.75%%0D%0AC%29 18.52%%0D%0AD%29 19.19% %0D%0AClick Link for Answer)
 on a particular day in housing complex of 50 families <br><img class="img-fluid pr-2 py-1 qImg extra-img" src="https://scorekhel.com/storage/practiceQuestion/Que11618/eng/extra-image.jpg" /><br> What is the ratio of the central angle corresponding to the sale of potatoes, tomatoes and beans together to the central angle corresponding to the combined sale of onions and others?)
 on a particular day in housing complex of 50 families<br><img class=\"img-fluid pr-2 py-1 qImg extra-img\" src=\"https://scorekhel.com/storage/practiceQuestion/Que11618/eng/extra-image.jpg\" /><br> What is the ratio of the central angle corresponding to the sale of potatoes, tomatoes and beans together to the central angle corresponding to the combined sale of onions and others?**%0D%0AA%29 11 : 13%0D%0AB%29 13 : 11%0D%0AC%29 13 : 15%0D%0AD%29 15 : 13 %0D%0AClick Link for Answer)
 from 2014 to 2018.<br><img class="img-fluid pr-2 py-1 qImg extra-img" src="https://scorekhel.com/storage/practiceQuestion/Que11730/eng/extra-image.jpg" /><br> The total exports of cars of type B from 2015 to 2018 is what percentage more than the total exports of cars of type A from 2015 to 2018 (correct to one decimal place)?)
 from 2014 to 2018.<br><img class=\"img-fluid pr-2 py-1 qImg extra-img\" src=\"https://scorekhel.com/storage/practiceQuestion/Que11730/eng/extra-image.jpg\" /><br> The total exports of cars of type B from 2015 to 2018 is what percentage more than the total exports of cars of type A from 2015 to 2018 (correct to one decimal place)?**%0D%0AA%29 14.9%%0D%0AB%29 15.5%%0D%0AC%29 17.2%%0D%0AD%29 16.7% %0D%0AClick Link for Answer)
 of successful start-ups in the industry of Health & sports, so that its success percentage is the same as that of Education?<br> Start-ups in various industries started since 2010 <br><img class="img-fluid pr-2 py-1 qImg extra-img" src="https://scorekhel.com/storage/practiceQuestion/Que11737/eng/extra-image.jpg" /><br> Successful start-ups in various industries)
 of successful start-ups in the industry of Health & sports, so that its success percentage is the same as that of Education?<br> Start-ups in various industries started since 2010 <br><img class=\"img-fluid pr-2 py-1 qImg extra-img\" src=\"https://scorekhel.com/storage/practiceQuestion/Que11737/eng/extra-image.jpg\" /><br> Successful start-ups in various industries**%0D%0AA%29 187%0D%0AB%29 155%0D%0AC%29 220%0D%0AD%29 127 %0D%0AClick Link for Answer)
 less than the total number of students whose marks are 120 and above?)
 less than the total number of students whose marks are 120 and above?**%0D%0AA%29 51.8%%0D%0AB%29 43.2%%0D%0AC%29 36.6%%0D%0AD%29 32.7% %0D%0AClick Link for Answer)
81 ∶ 80