SSC CGL 2022 objective Ques (132 results)
31)The following bar graph shows the total number of youth (in lakhs) and the number of employed youth (in lakhs) in 5 states A, B, C, D and E.
The number of employed youth in state B is what percentage of the number of employed youth in state E?SSC CGL 2022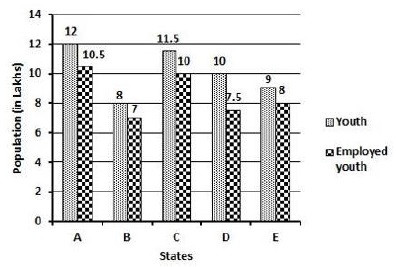
87.5%
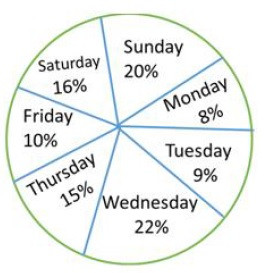
SSC CGL 202232)Study the given pie chart and answer the question that follows.
The pie chart represents the percentage-wise distribution of the total number of Vanilla cakes and Chocolate cakes sold everyday in a week. The total number of cakes sold in a week = 10500.
The ratio of the number of Vanilla cakes sold to the number of Chocolate cakes sold on Saturday is 4 ∶ 3, the selling price of one Vanilla cake is Rs. 8 and that of one Chocolate cake is Rs. 15, then the total amount earned (in Rs.) by selling all Vanilla cakes and Chocolate cakes on Saturday is:
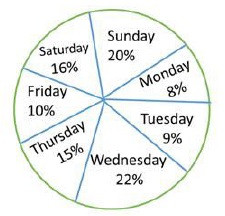
18,480
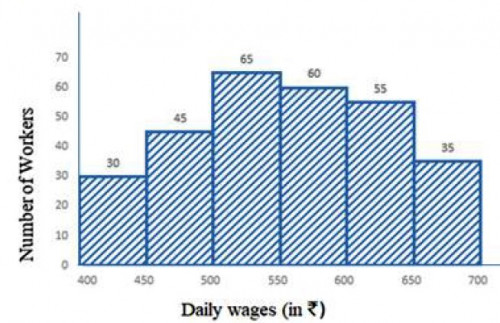
SSC CGL 202233)Study the given histogram and answer the question that shows the marks obtained by students in an examination and answer the question that follows.
The number of students who obtained less than 200 marks is what percentage less than the number of students who obtained 400 or more marks (correct to one decimal place)?
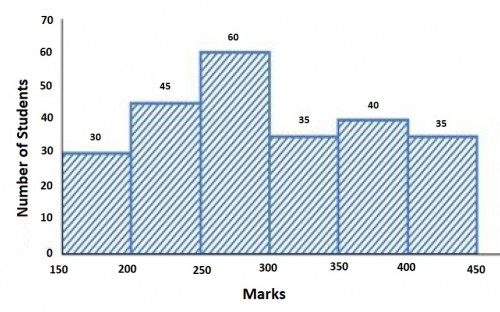
14.3%
34)The following bar graph shows the total number of youth (in lakhs) and the number of employed youth (in lakhs) in 5 states A, B, C, D and E.
What is the percentage of employed youth in states A and E taken together?SSC CGL 2022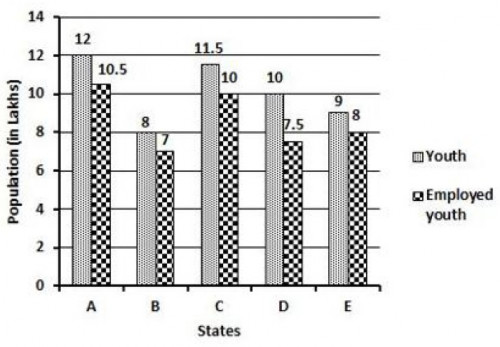
\(88\frac{2}{21}\)
SSC CGL 202235)Study the given bar graph and answer the question that follows.
The bar graph shows the exports of cars of type A and B (in ₹ millions) from 2014 to 2018.
What is the ratio of the total exports of cars of type A in 2016 and 2018 to the total exports of cars of type B in 2015 and 2017?
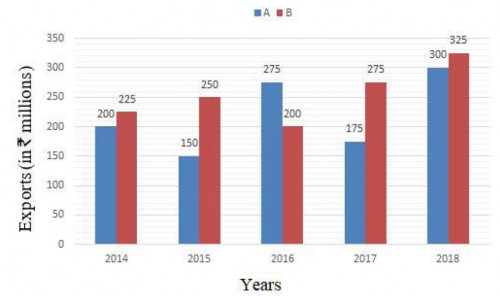
23 : 21
SSC CGL 202236)Study the given pie-chart and answer the question that follows.
The chart represents the percentage-wise distribution of total number of vanilla cakes and chocolate cakes sold every day in a week. Total number of cakes sold in a week = 10500.
The ratio of vanilla cakes sold to chocolate cakes sold on Friday is 4 : 3. If the selling price of one vanilla cake is ₹9 and that of one chocolate cake is ₹10, then the total amount earned (in ₹) by selling all the vanilla cakes and chocolate cakes on Friday is:
9,900
SSC CGL 202237)The given bar chat represents the Televisions Sets (TV) manufactured (in thousands) and the respective percentage of those TV Sets sold by five different companies A, B, C, D and E in 2015.
Study the chart carefully and answer the question that follows.
What is the ratio of the number of TV sets sold by company A to that of company B in 2015?
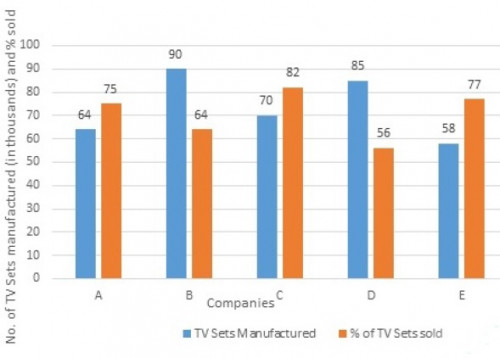
5 : 6
SSC CGL 202238)Study the given histogram and answer the question that follows.
What is the difference between the total number of workers whose daily wages are less than ₹450 and the total number of workers whose daily wages are ₹650 and above?
5
SSC CGL 202239)The following bar chart shows the number of students enrolled in two Summer Camps A and B from 2014 to 2019. Study the chart carefully and answer the question that follows.
What is the ratio of the students enrolled in Camp A in 2014, 2016 and 2017 to the students enrolled in Camp B in 2015, 2018 and 2019?
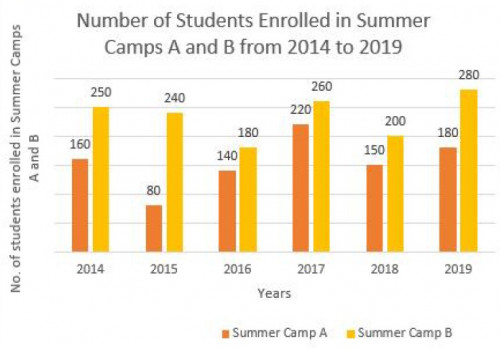
13 : 18
SSC CGL 202240)The given pie chart shows the percentage of students in five schools and the table shows the ratio of boys and girls in each school.
Study the pie chart and table and answer the question that follows.
The below table shows the ratio of girls and boys in the given five schools.
What is the ratio of the number of boys in school C to the number of girls in school E?
School Girls : Boys A 3 ∶ 4 B 2 : 3 C 5 : 3 D 1 : 2 E 4 : 1
 by selling all Vanilla cakes and Chocolate cakes on Saturday is:)
 by selling all Vanilla cakes and Chocolate cakes on Saturday is:**%0D%0AA%29 20,000%0D%0AB%29 14,880%0D%0AC%29 18,480%0D%0AD%29 10,488 %0D%0AClick Link for Answer)
?)
?**%0D%0AA%29 21.6%%0D%0AB%29 11.9%%0D%0AC%29 17.8%%0D%0AD%29 14.3% %0D%0AClick Link for Answer)
 from 2014 to 2018.<br><img class="img-fluid pr-2 py-1 qImg extra-img" src="https://scorekhel.com/storage/practiceQuestion/Que10845/eng/extra-image.jpg" /><br> What is the ratio of the total exports of cars of type A in 2016 and 2018 to the total exports of cars of type B in 2015 and 2017?)
 from 2014 to 2018.<br><img class=\"img-fluid pr-2 py-1 qImg extra-img\" src=\"https://scorekhel.com/storage/practiceQuestion/Que10845/eng/extra-image.jpg\" /><br> What is the ratio of the total exports of cars of type A in 2016 and 2018 to the total exports of cars of type B in 2015 and 2017?**%0D%0AA%29 13 : 12%0D%0AB%29 5 : 4%0D%0AC%29 23 : 21%0D%0AD%29 10 : 9 %0D%0AClick Link for Answer)
 by selling all the vanilla cakes and chocolate cakes on Friday is:<br>)
 by selling all the vanilla cakes and chocolate cakes on Friday is:<br>**%0D%0AA%29 11,000%0D%0AB%29 10,000%0D%0AC%29 8,900%0D%0AD%29 9,900 %0D%0AClick Link for Answer)
 manufactured (in thousands) and the respective percentage of those TV Sets sold by five different companies A, B, C, D and E in 2015.<br> Study the chart carefully and answer the question that follows.<br><img class="img-fluid pr-2 py-1 qImg extra-img" src="https://scorekhel.com/storage/practiceQuestion/Que11417/eng/extra-image.jpg" /><br> What is the ratio of the number of TV sets sold by company A to that of company B in 2015?)
 manufactured (in thousands) and the respective percentage of those TV Sets sold by five different companies A, B, C, D and E in 2015.<br> Study the chart carefully and answer the question that follows.<br><img class=\"img-fluid pr-2 py-1 qImg extra-img\" src=\"https://scorekhel.com/storage/practiceQuestion/Que11417/eng/extra-image.jpg\" /><br> What is the ratio of the number of TV sets sold by company A to that of company B in 2015?**%0D%0AA%29 4 : 5%0D%0AB%29 5 : 4%0D%0AC%29 5 : 6%0D%0AD%29 6 : 5 %0D%0AClick Link for Answer)
3 : 4