SSC CGL 2022 objective Ques (132 results)
SSC CGL 202211)The following bar graph shows the total number of youth (in lakhs) and the number of employed youth (in lakhs) in 5 states A, B, C, D and E.
Which state has the maximum number of unemployed youth?

D
SSC CGL 202212)Study the given histogram that shows the height (in cm) of 100 students in an athletic team and answer the question that follows.
Express the number of students with height less than 170 cm as the percentage (correct to one decimal place) of the number of students with height more than 160 cm.
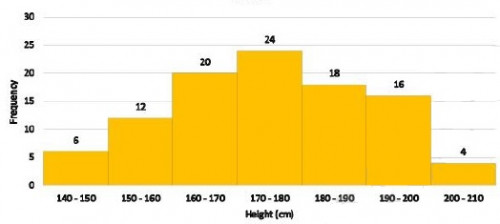
46.3%
13)The following bar graph shows the total number of youth (in lakhs) and the number of employed youth (in lakhs) in states A, B, C, D and E.
What is the ratio of the number of youth in states A, C and E taken together to the number of employed youth in states B, C and D taken together?SSC CGL 2022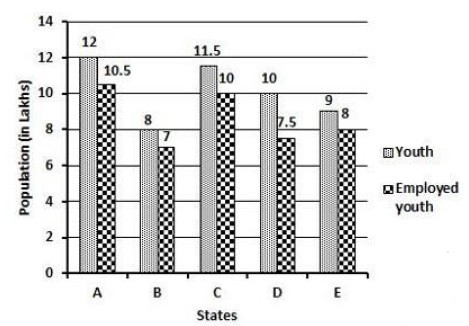
65 ∶ 49
14)Monthly expenditure of a family on different heads is shown in the following pie chart.
What is the percentage of family earnings spent on rent?SSC CGL 2022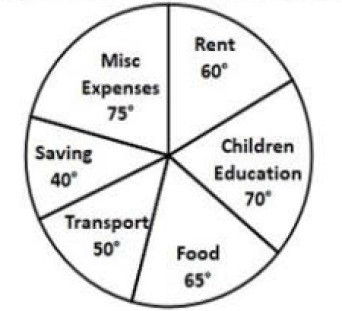
\(16\frac{2}{3}\)
SSC CGL 202215)The given bar graph shows exports of cars of type A and B (in Rs millions) from 2014 to 2018. Study the graph and answer the question that follows.
What is the ratio of the total exports of cars of type A in 2014 and 2018 to the total exports of cars of type B in 2015 and 2017?
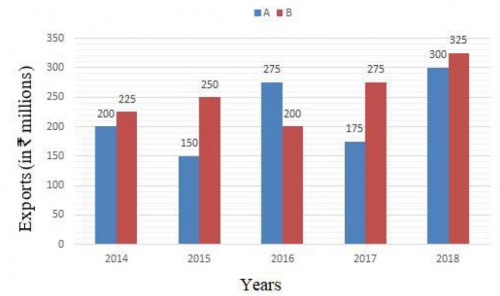
20 ∶ 21
16)The following histogram shows the marks scored by 40 students in a test of 30 marks. A student has to score a minimum of 10 marks to pass the test.
How many students have scored less than two-third of the total marks?SSC CGL 2022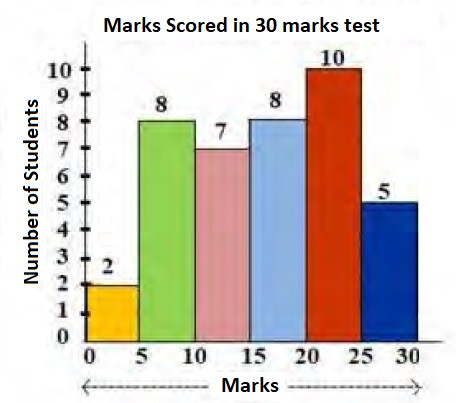
25
17)The following bar graph shows the number of youth (in lakhs) and the number of employed youth (in lakhs) in 5 states A, B, C, D and E.
In which state(s) is the number of youth more than the average number of youth in the five states?SSC CGL 2022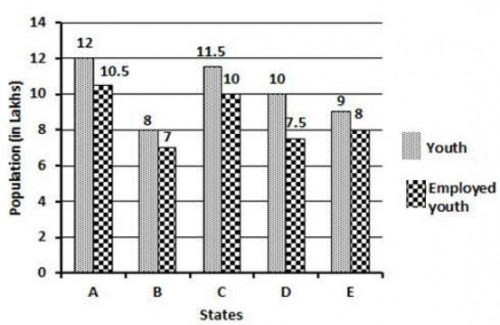
A, C
SSC CGL 202218)The breakup of the total number of employees of a company working in different offices (A to E), in degrees, is given in the pie chart.
Total number of employees = 2400.
In which office is the number of employees 600?
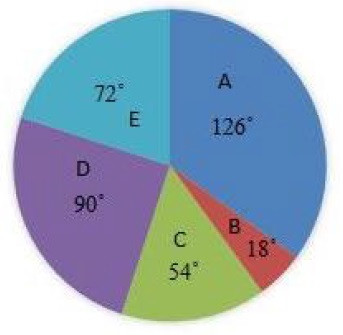
D
SSC CGL 202219)The following bar chart shows the number of students enrolled in two summer Camps A and B from 2014 to 2019. Study the chart carefully and answer the question that follows.
The number of students enrolled in Camp A in 2016 and 2019 together is what percentage of the number of students enrolled in Camp B in 2015 and 2017 together?
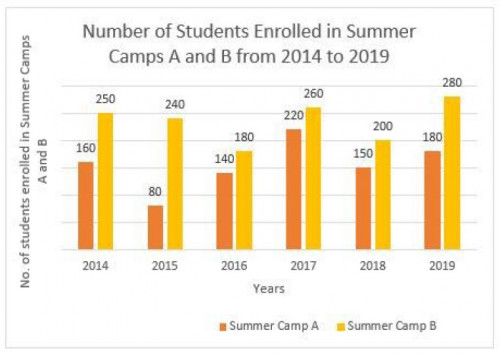
64%
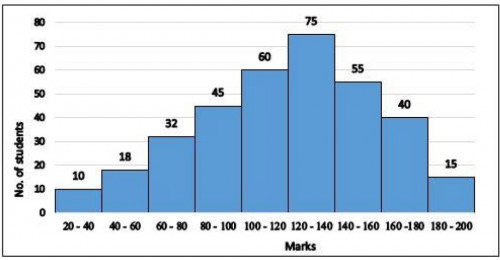
SSC CGL 202220)The given histogram represents the marks of students in Mathematics test of a certain class. The total number of students is 350 and the maximum marks of the test are 200.
Study the graph and answer the question that follows.
What is the class average (correct up to one place of decimal) of mathematics test?
 and the number of employed youth (in lakhs) in 5 states A, B, C, D and E.<br><img class="img-fluid pr-2 py-1 qImg extra-img" src="https://scorekhel.com/storage/practiceQuestion/Que10240/eng/extra-image.jpg" /><br> Which state has the maximum number of unemployed youth?)
 and the number of employed youth (in lakhs) in 5 states A, B, C, D and E.<br><img class=\"img-fluid pr-2 py-1 qImg extra-img\" src=\"https://scorekhel.com/storage/practiceQuestion/Que10240/eng/extra-image.jpg\" /><br> Which state has the maximum number of unemployed youth?**%0D%0AA%29 D%0D%0AB%29 B%0D%0AC%29 E%0D%0AD%29 A %0D%0AClick Link for Answer)
 of 100 students in an athletic team and answer the question that follows.<br><img class="img-fluid pr-2 py-1 qImg extra-img" src="https://scorekhel.com/storage/practiceQuestion/Que10247/eng/extra-image.jpg" /><br> Express the number of students with height less than 170 cm as the percentage (correct to one decimal place) of the number of students with height more than 160 cm.)
 of 100 students in an athletic team and answer the question that follows.<br><img class=\"img-fluid pr-2 py-1 qImg extra-img\" src=\"https://scorekhel.com/storage/practiceQuestion/Que10247/eng/extra-image.jpg\" /><br> Express the number of students with height less than 170 cm as the percentage (correct to one decimal place) of the number of students with height more than 160 cm.**%0D%0AA%29 46.3%%0D%0AB%29 53.7%%0D%0AC%29 73.5%%0D%0AD%29 29.1% %0D%0AClick Link for Answer)
 from 2014 to 2018. Study the graph and answer the question that follows.<br><img class="img-fluid pr-2 py-1 qImg extra-img" src="https://scorekhel.com/storage/practiceQuestion/Que10342/eng/extra-image.jpg" /><br> What is the ratio of the total exports of cars of type A in 2014 and 2018 to the total exports of cars of type B in 2015 and 2017?)
 from 2014 to 2018. Study the graph and answer the question that follows.<br><img class=\"img-fluid pr-2 py-1 qImg extra-img\" src=\"https://scorekhel.com/storage/practiceQuestion/Que10342/eng/extra-image.jpg\" /><br> What is the ratio of the total exports of cars of type A in 2014 and 2018 to the total exports of cars of type B in 2015 and 2017?**%0D%0AA%29 10 ∶ 9%0D%0AB%29 20 ∶ 21%0D%0AC%29 5 ∶ 4%0D%0AD%29 13 ∶ 12 %0D%0AClick Link for Answer)
, in degrees, is given in the pie chart.<br> Total number of employees = 2400.<br><img class="img-fluid pr-2 py-1 qImg extra-img" src="https://scorekhel.com/storage/practiceQuestion/Que10435/eng/extra-image.jpg" /><br> In which office is the number of employees 600?)
, in degrees, is given in the pie chart.<br> Total number of employees = 2400.<br><img class=\"img-fluid pr-2 py-1 qImg extra-img\" src=\"https://scorekhel.com/storage/practiceQuestion/Que10435/eng/extra-image.jpg\" /><br> In which office is the number of employees 600?**%0D%0AA%29 C%0D%0AB%29 A%0D%0AC%29 E%0D%0AD%29 D %0D%0AClick Link for Answer)
 of mathematics test?)
 of mathematics test?**%0D%0AA%29 115.8%0D%0AB%29 123.7%0D%0AC%29 119.3%0D%0AD%29 127.3 %0D%0AClick Link for Answer)
119.3