SSC CGL 2022 objective Ques (132 results)
131)The bar graph given below shows the percentage distribution of the total production of six different types of cars by a car manufacturing company over 2 years.
The total number of cars of type P, R and U manufactured in 2001 is:SSC CGL 2022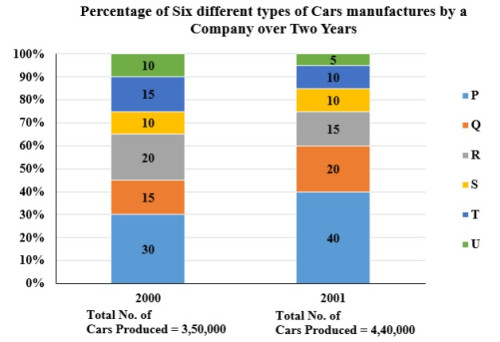
Correct Option: D
2,64,000
Hint::
132)The following pie chart shows the population of 7 villages.
What is the difference between the population of villages E and D, if the total population of all the villages together is 50,000?SSC CGL 2022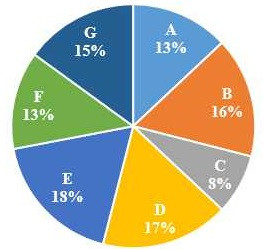
Correct Option: C
500
Hint::
showing 131 - 132 results of 132 results