SSC CGL 2022 objective Ques (132 results)
SSC CGL 2022121)The table given below shows the number of people in different states.
What is the average number of people in all the states?
State Number of people F 474 G 500 H 444 I 495 J 580
498.6
122)Study the given graph and table and answer the following question.
Data of different states regarding population of states in the year 1998
What was the number of males in Bihar in the year 1998?SSC CGL 2022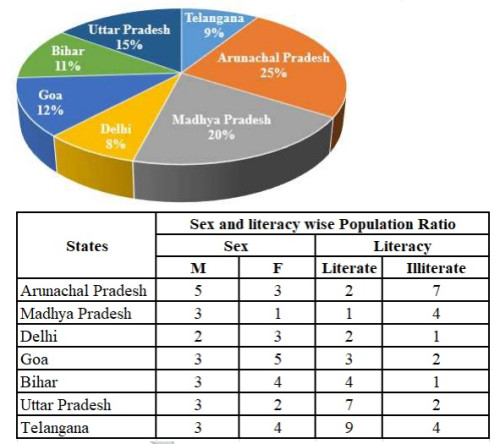
15,44,400
SSC CGL 2022123)The following table shows the exports of three companies P, Q and R from 2015 to 2019.
Which of the following years has the highest total exports from the three companies together?
Company/ years ⇒ 2015 2016 2017 2018 2019 P 2000 1000 2000 3000 4000 Q 4000 5000 4000 5000 3000 R 3000 2000 4000 4000 5000
2019
124)Study the given graph and answer the following question.
If 35% of the lecturers recruited in state B in the year 2021 were male, what was the number of females in state B in that year?SSC CGL 2022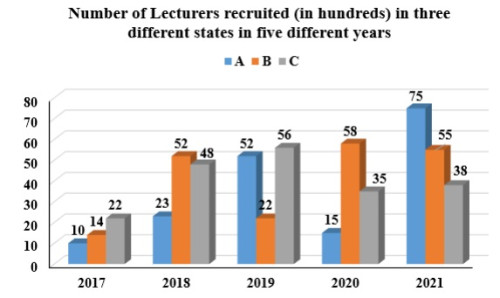
3575
SSC CGL 2022125)The table given below shows the number of tractor sold by two companies.
Number of tractor T5 sold by both companies is how much percent more than the number of tractor T2 sold by both companies?
Company Tractor P Q T1 60 90 T2 40 50 T3 80 100 T4 90 120 T5 110 150
188.88 percent
SSC CGL 2022126)The table given below shows the number of scissor sold by five shopkeepers.
What are the ratio of number of scissor sold by R to the sold by S?
Shopkeepers Scissors P 30 Q 50 R 45 S 25 T 70
9 : 5
SSC CGL 2022127)The production of ABC Ltd is as follows.
For which product did the company record the highest growth rate?
Product 2021 2022 A 120 150 B 160 200 C 250 300 D 60 90 E 30 50 F 110 132
E
128)The pie chart given below shows the marks obtained by student Q in 6 different subjects. The total marks obtained by the student in these subjects is 700. Marks obtained in a particular subject is shown as a percent of total marks obtained in all these 6 subjects.
What is total marks obtained in Q, S and U?SSC CGL 2022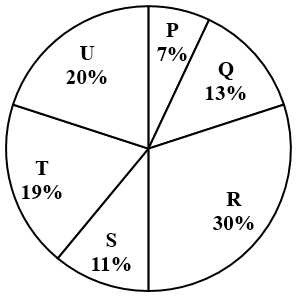
308
SSC CGL 2022129)The given table shows the number of new employees joined in different categories of employees in an organisation and also the number of employees from these categories who left the organisation every year since the foundation of the organisation in 2015. Study the table and answer the question that follows.
During the years given, what is the difference between the total number of Business Analysts who joined the organisation and the total number of Sales Representatives who joined the organisation?
Year
Business Analysts
Accountants
Sales Representatives
Peons
Joined
Left
Joined
Left
Joined
Left
Joined
Left
2015
80
0
35
0
50
0
73
0
2016
63
21
26
16
46
20
34
23
2017
78
28
15
5
38
15
48
23
2018
42
39
20
38
34
0
14
12
2019
67
44
14
24
22
30
21
30
140
130)The following pie charts show the percentage of employees in each department and the percentage of males working in each department.
Find the number of females working in the production department.SSC CGL 2022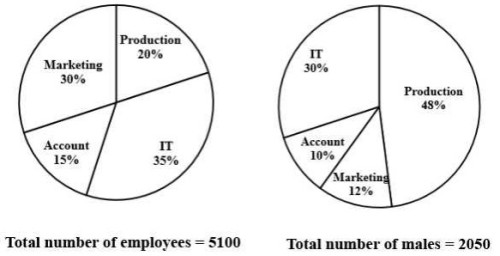
36