SSC CGL 2022 objective Ques (132 results)
111)In the following bar diagram, there are 5 companies A, B, C, D and E. The diagram shows the demand of a product and its production the above five companies.
If x% of the demand of the product by Company C is equal to that of the Company B, then find the value of x.SSC CGL 2022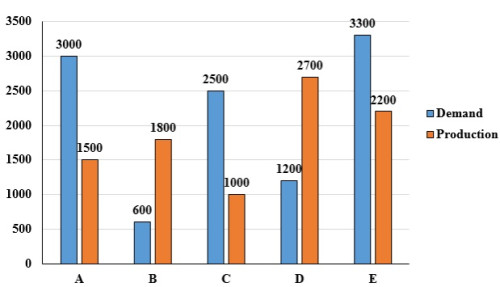
24
112)The number of mobile sim-cards in 4 states/UT are given in the bar diagram. Study the diagram and answer the question.
In which State\UT is there the smallest number of owners of the BSNL Sim-card?SSC CGL 2022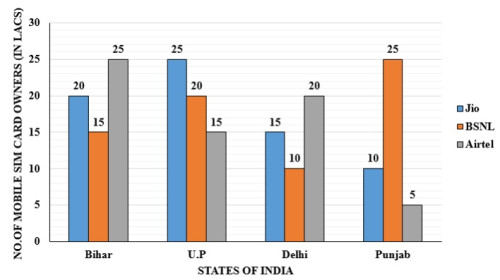
Bihar
113)The bar graph given below shows the percentage distribution of the total production of six different types of cars by a car manufacturing company over 2 years.
If 75% of the T type cars produced in each year were sold by the company, how many T type cars remain unsold?SSC CGL 2022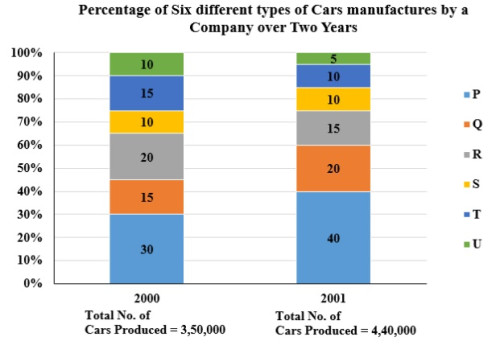
24125
SSC CGL 2022114)The table given below shows the number of working days of a company in 5 years.
What are ratio of number of working days in year R to the number of working days in year T?
Years
Working days
P
110
Q
310
R
160
S
60
T
210
16 : 21
SSC CGL 2022115)The table given below shows the number of salesman in five companies.
Number of salesman in J is what percent of the number of salesman in K?
Companies
Salesman
J
45
K
20
L
40
M
15
N
25
225 percent
116)Study the given graph and answer the following question.
The number of lecturers recruited in state B in the year 2019 was what percentage of the number of lecturers recruited in state C in the year 2021? (Correct to 2 decimal places.)SSC CGL 2022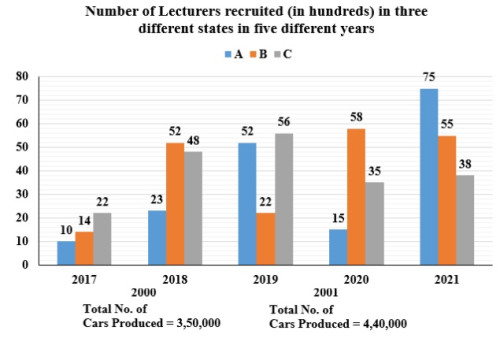
57.89 %
117)The given bar diagram represents the number of persons who have taken an insurance policy on the y-axis, and the year of purchase of the insurance policy on the x-axis.
What is the average number of persons who have taken the insurance policy, excluding in the year 2012?SSC CGL 2022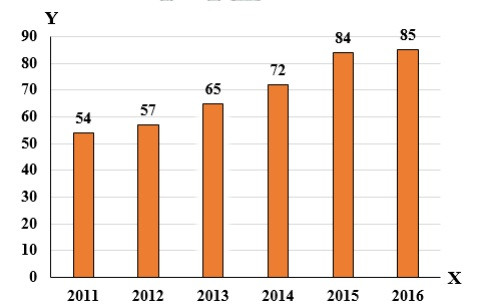
72
SSC CGL 2022118)The table given below shows the budget allocation for education in five states in a year.
What is the total budget allocation for education in all the states?
States Budget allocation D 225 E 75 F 250 G 425 H 535
1510
SSC CGL 2022119)The table given below shows the GDP of two countries in different five years.
Country Years A B Y1 175 285 Y2 200 300 Y3 150 125 Y4 75 85 Y5 50 95
K1 = The value of average GDP of country A in all the 5 years.
K2 = The value of average GDP of country B in all the 5 years.
What is the value of (K1 + K2)?
308
SSC CGL 2022120)The following table shows the marks distribution among the students in a class.
How many students scored marks between 20 and 30?
Marks No. of Students Less than 10 2 Less than 20 5 Less than 30 6 Less than 40 8 Less than 50 10
1