SSC CGL 2022 objective Ques (132 results)
SSC CGL 2022101)The table given below shows the cost price and selling of four different articles.
What is the difference between the average selling price and average cost price of all the articles?
Articles
Cost price
Selling price
J
650
750
K
370
450
L
450
650
M
590
650
110
102)The pie chart given below shows the number of boys in 8 schools. The total number of boys in all these 8 school is 5000. Number of boys in a particular school is shown as a percent of total number of boys in all these 8 schools.
What is the ratio of total number of boys in B, D and E to the total number of boys in A, C and F?SSC CGL 2022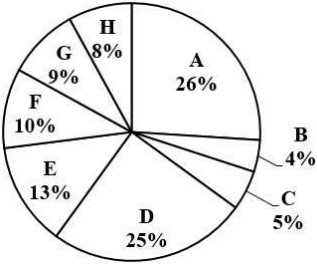
37 ∶ 57
103)The pie chart given below shows the number of car sold by 8 different companies. The total number of car sold by all these 8 companies are 5,000. Number of cars sold by a particular company is shown as a percent of total number of cars sold by all these 8 companies.
What is the ratio of total central angle formed by sector R and S to the total central angle formed by sector U and V?SSC CGL 2022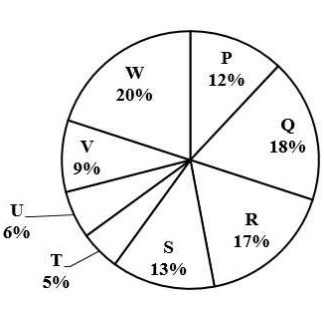
2 ∶ 1
SSC CGL 2022104)The table given below shows the sales turnover of 5 different companies.
What is the difference between the sales turnover of company H and F?
Company
Sales turnover
E
270
F
230
G
350
H
400
I
300
170
105)The following bar chart shows the export of a certain commodity P in crore rupees between 2014 and 2020.
For how many years, there was less export of P than the average export of P?SSC CGL 2022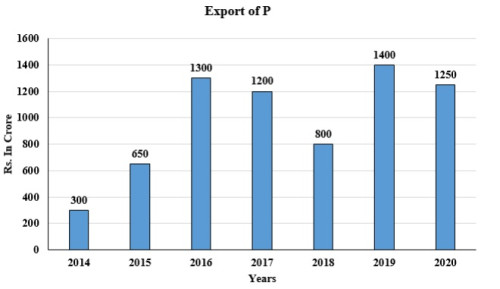
3
106)The following line graph displays the ratio of exports to imports (in terms of money in ₹ crores) of company A from 2010 to 2015.
Study the graph carefully and answer the question based on the given line graph.
In how many years, the export of company A was more than the company's import?SSC CGL 2022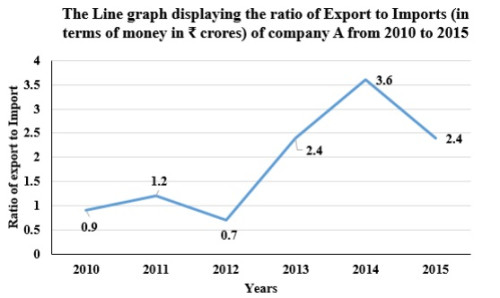
Four
SSC CGL 2022107)The table given below shows the foreign trade by two countries in 5 different years.
What is the total foreign trade by country M in all the 5 years?
Country
Years
L
M
Y1
250
125
Y2
230
185
Y3
155
275
Y4
145
255
Y5
115
170
1010
108)The pie-chart shows marks of a student in different subjects out of 100.The marks scored in Hindi and Mathematics are more than the marks scored in English and Science by:
SSC CGL 2022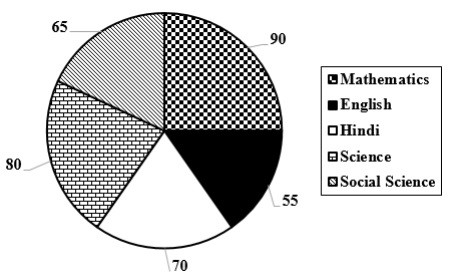
25
SSC CGL 2022109)The table given below shows the sales turnover of 5 different companies.
The sales turnover of company A is what percent of the sales turnover of company C?
Company Sales turnover A 120 B 80 C 200 D 250 E 150
60 percent
110)The pie chart given below shows the production of 6 different factories. The total production of all these 6 factories is 15000. The production of a particular factory is shown as a percent of total production of all these 6 factories.
J1 = The value of average production of factories F3 and F6.
J2 = The difference between the production of factory F1 and F4. What is the value of (J2 - J1)?SSC CGL 2022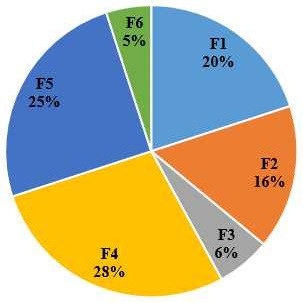
375